
Figures & data
Figure 1. Flow chart of the Finnish Study 2018 population.
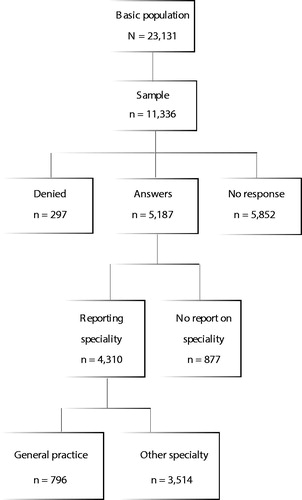
Table 1. Respondents’ distributions (%) and comparisons of sociodemographic features and opinions to education in research during education among doctors in general practice and other specialties.
Figure 2. Proportion (%) of GPs and doctors in other specialties in different age groups having started or completed a doctorate.
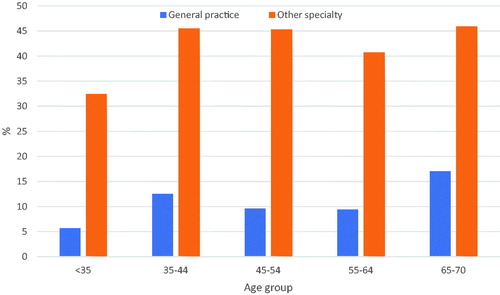
Table 2. Intention on completing a doctorate in the Physician 2018 Study.
Table 3. Factors associated with intention to undertake a doctorate among GPs in univariate and multivariate logistic regression analyses.