Figures & data
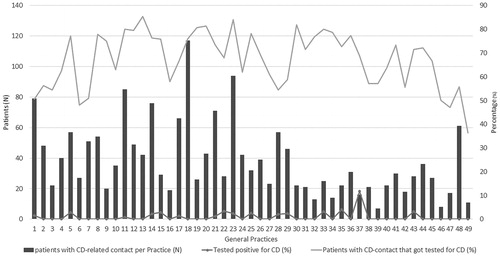
Figure 1. Figure one depicts the search string that was used to find eligible cases. Three techniques were used that to find cases both separate from each other or combined (and/or). In free text annotations, in the ICPC coding system and in laboratory test results. TTG: tissue Transglutaminase, HLA: human leukocyte antigen, ICPC: International Classification of Primary Care, D99.06: code for coeliac disease diagnosis.
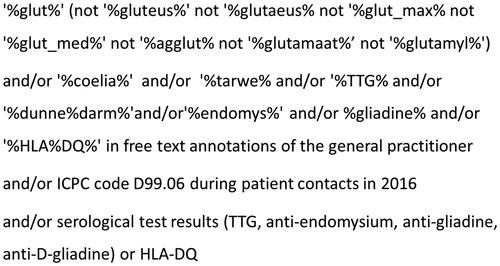
Figure 2. Flowchart of search strategy and patient selection based on general practice contacts in 2016 related to gluten or coeliac disease in a cohort of 207.200 patients distributed over 49 general practices and distribution of diagnosis in the included study population (n = 1972). ICPC-1: International Classification of Primary Care, D99.06: ICPC-1 code for coeliac disease, GP: general practitioner, CD: coeliac disease, NCGS: non-coeliac gluten sensitivity, tTGA: tissue Transglutaminase antibodies, GDS: gastroduodenoscopy. *1: Number of patients registered in 49 of the general practices associated with the Academic network of general practice at VU University Medical Centre in 2016, *2 patients with a confirmed diagnosis out of all patients that were referred to a specialist.
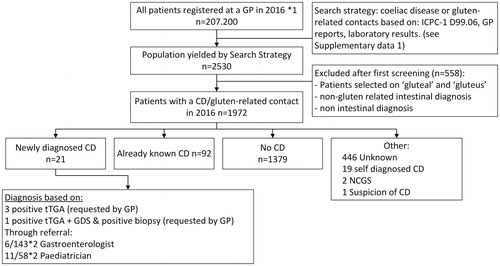
Table 1. Baseline characteristics of all patients (n = 1972) with at least one coeliac disease or gluten-related general practice contact in 2016.
Table 2. Recorded main reason for CD-or gluten related contact in 2016, and the frequency of serological testing and positive test results in the study population (n = 1972).
Figure 3. Heterogeneity between general practices (n = 49) in the numbers of patients with at least one coeliac disease or gluten-related contact in 2016 and in the diagnostic approach. Patients that were diagnosed before 2016 were excluded from analysis. On the horizontal axis the participating practices are numbered arbitrarily from 1 to 49. The left vertical axis shows the number of patients that had at least one CD-related contact in 2016. The right vertical axis depicts the percentage of these patients that got tested for CD (orange/upper line) in 2016, and the percentage of these tested patients that were diagnosed with CD (black/lower dotted line). CD: coeliac disease.