
Figures & data
Table 1. People at the beginning of follow-up, person-years of follow-up, and sex and age-adjusted incidence rates of diabetes and regression to normoglycemia per 1000 person-years according prediabetes category.
Table 2. Sex and age-adjusted probabilities of diabetes non-onset and onset, odds of diabetes non-onset versus onset and sex and age-adjusted probability of reversion to normoglycemia.
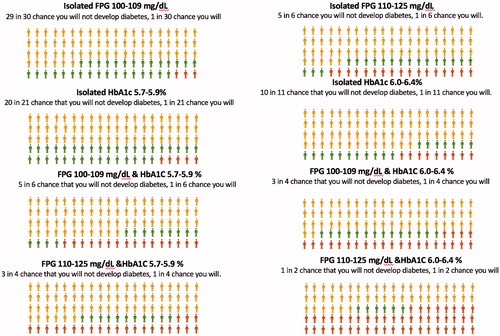
Figure 1. Pictograms to explain the prognosis of prediabetes per 100 people at five years’ follow-up in each prediabetes category in the PREDAPS study. Probability of diabetes non-onset versus onset, and number of people who revert to normoglycemia, continue with prediabetes , and who develop diabetes .
Supplemental material