Figures & data
Figure 1. Demonstrating flow of the study.
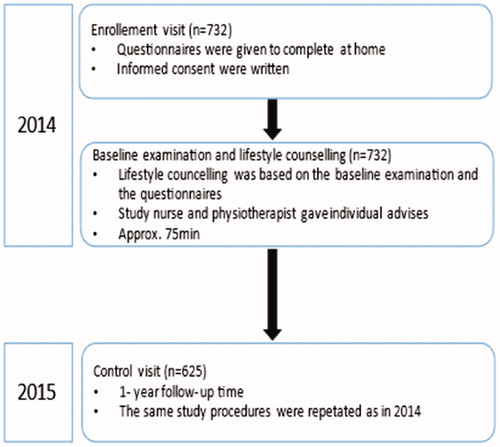
Figure 2. Distribution of the Body Mass Index in the study population. Box-and-whiskers plot shows median and IQR (interquartile range), and whiskers indicate 5th and 95th percentile.
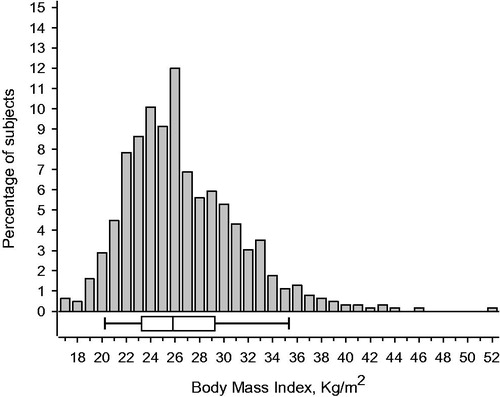
Table 1. Characteristics of the subjects according to categories of weight change and change in the quality of life (EUROHIS-8).
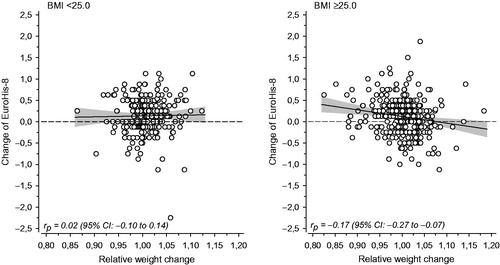
Figure 3. The relationship between the change of EUROHIS-8 score and the relative weight change among normal weight (BMI <25 kg/m2) and overweight/obese subjects (BMI ≥25 kg/m2) at baseline. The line shows the estimated linear regression with 95% confidence intervals.