
Figures & data
Table 1. Self-rated health (SRH) in the last 7 days by gender.
Table 2. Characteristics of the patients in the study, and their SRH in the past 7 days.
Table 3. The association between independent variables and poor SRH in the past 7 days.
Figure 1. Percentage of patients reporting poor SRH according to the number of symptoms in the past week.
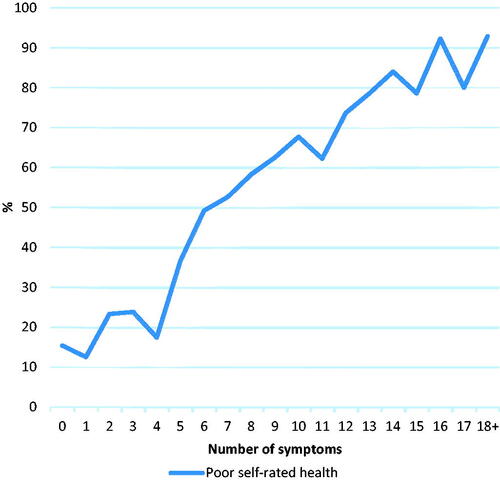
Figure 2. Predicted probability of poor self-rated health according to the number of symptoms reported by the patients and the most prevalent diagnoses given by their GPs.
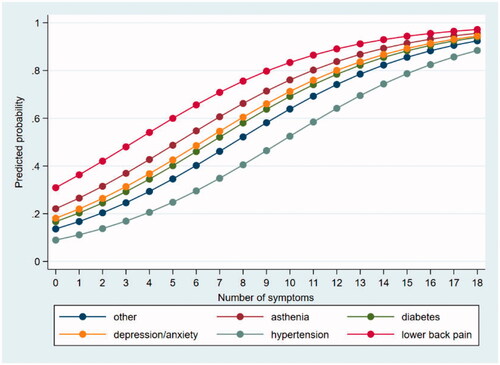
Table 4. Individual symptoms reported in the past week and associations with poor SRH.