Figures & data
Table 1. Study population characteristics of pancreatic cancer patients diagnosed in 2012–2018 and references without pancreatic cancera.
Figure 1. Contacts* in general practice for 5926 pancreatic cancer patients and 59,260 references without pancreatic cancer. *Number of contacts include daytime face-to-face contacts, email consultations and telephone consultations in the 12 months prior to the pancreatic cancer diagnosis date and a corresponding index date assigned to references without pancreatic cancer. Number of contacts are presented as crude rates of mean number of contacts per month (upper part) and incidence rate ratios (lower part) adjusted for age, marital status, ethnicity, educational level, household income and comorbidity. Black lines represent 95% confidence intervals.
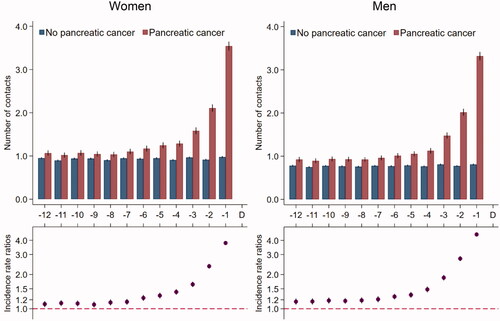
Figure 2. Tests* in general practice for 5926 pancreatic cancer patients and 59,260 references without pancreatic cancer. *Number of tests in the 12 months prior to the pancreatic cancer diagnosis date and a corresponding index date assigned to references without pancreatic cancer. Number of tests are presented as crude rates of mean number of tests per month (upper part) and incidence rate ratios (lower part) adjusted for age, marital status, ethnicity, educational level, household income and comorbidity. Black lines represent 95% confidence intervals.
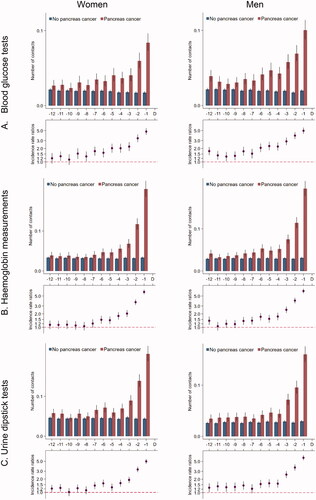
Figure 3. Number of hospital contacts* for 5926 pancreatic cancer patients and 59,260 references without pancreatic cancer. *Number of contacts in the 12 months prior to the pancreatic cancer diagnosis date and a corresponding index date assigned to references without pancreatic cancer. Number of contacts are presented as crude rates of mean number of tests per month (upper part) and incidence rate ratios (lower part) adjusted for age, marital status, ethnicity, educational level, household income and comorbidity. Black lines represent 95% confidence intervals.
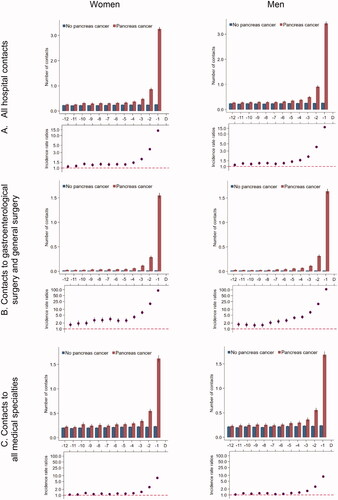
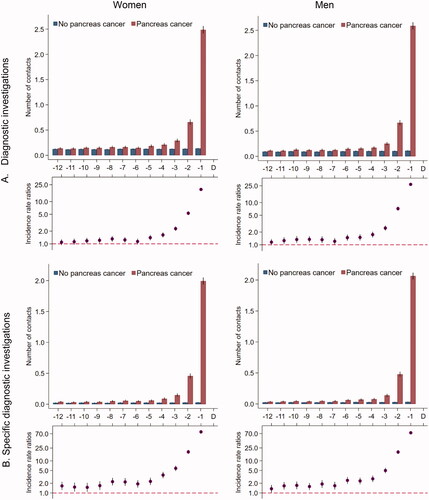
Figure 4. Number of diagnostic investigations* for 5926 pancreatic cancer patients and 59,260 references without pancreatic cancer. (A) All MR scans, CT scans, ultrasound and X-ray. (B) Ultrasound abdomen, MR thorax/abdomen/pelvis, CT thorax/abdomen/pelvis. *Number of diagnostic investigations in the 12 months prior to the pancreatic cancer diagnosis date and a corresponding index date assigned to references without pancreatic cancer. Number of diagnostic investigations are presented as crude rates of mean number of investigations per month (upper part) and incidence rate ratios (lower part) adjusted for age, marital status, ethnicity, educational level, household income and comorbidity in model A and comorbidity in model B. Black lines represent 95% confidence intervals.