Figures & data
Table 1. Flow of data, per contact type (n).
Table 2. Contact-, patient- and GP-related characteristics, proportion by contact type (in %).
Figure 1. Histogram presenting raw antibiotic prescription rates, per contact type.
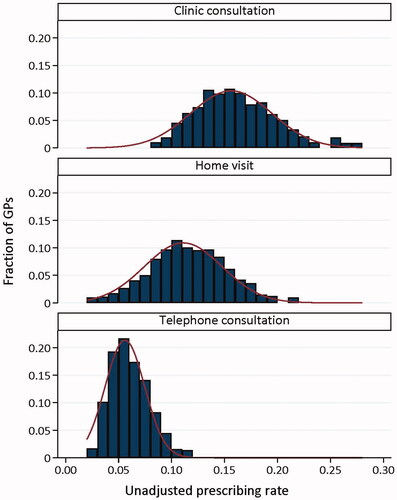
Figure 2. Adjusteda APTs, per contact type. The simulated curves (grey) represent the situation in which all GPs act similarly. aAdjusted for contact characteristics (year, month, time to next in-hours period, and patient load regionally past hour) and patient characteristics (age, sex, education level, income, living status, ethnicity, urbanisation, comorbidity, and patient GP/OOH contacts in the past 12 months). Left Y-axis: The adjusted APT presents the individual GP’s likelihood of prescribing antibiotics compared to the average GP. Right Y-axis: The APT is converted to an adjusted prescribing rate by multiplying the APT by the observed average prescribing rate for each contact type.
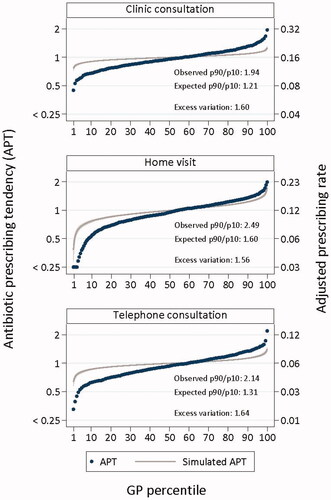
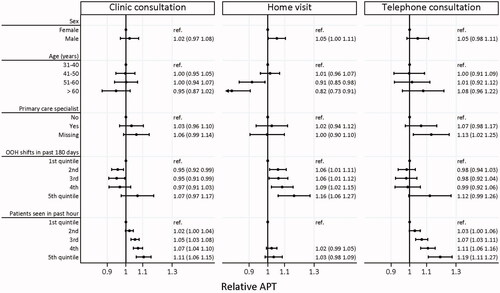
Figure 3. Adjusted relative risk of antibiotic prescribing tendency (APT) according to GP characteristics, stratified by contact type. Antibiotic prescribing tendency (APT) is the tendency of each individual GP to prescribe antibiotics compared to the average GP, calculated by dividing the number of observed antibiotic prescriptions by the number of expected prescriptions predicted by a model correcting for the case-mix of the patient population of each individual GP. Presented estimates were mutually adjusted, meaning, for example, GP sex effect was adjusted for GP age and vice versa. OOH shifts past 180 days refer to the number of similar shifts at out-of-hours (OOH) primary care done by the individual GP. Patients seen in the past hour refers to the total number of patients seen in the hour up to the index contact.