Figures & data
Table 1. Baseline characteristics of participants.
Figure 1. (A) Change in the relative proportions of DDDs (rDDDs) for all psychotropics. (B) Change in rDDDs in psychotropics analyzed by various subgroups. Adjusted for sex, age, and Charlson comorbidity index.
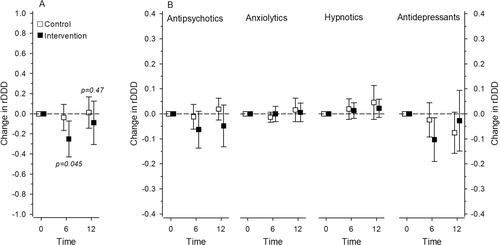
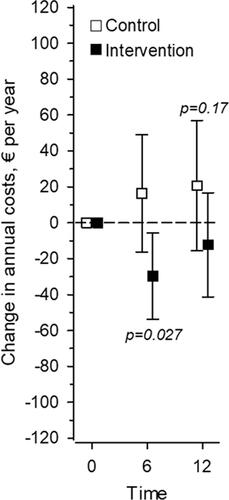
Figure 2. Change in annual cost (in Euros) of psychotropics. Adjusted for sex, age, and Charlson comorbidity index.