
Figures & data
Table 1. List of indexes that represent reimbursement to primary care centers and proportional distribution of payments in 2017 and 2018 from each index.
Table 2. Reimbursement to primary care centers in 2018, reported in thousands of Icelandic kronaa [Citation21].
Figure 1. Reimbursements in 2018 for (a) GPs at each center, (b) all registered patients at a center, and (c) patient visits. The dark color is for public centers and dots represent private centers.
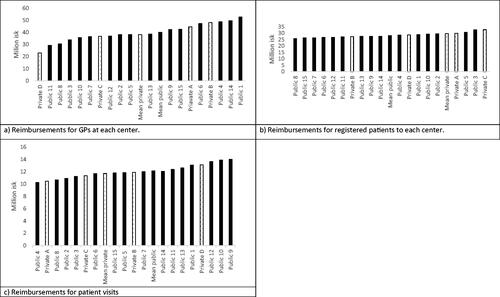
Figure 2. Increase in number of patients and diagnosis from 2017 to 2018 [Icelandic health insurance, personal communication, 27 January 2021].
![Figure 2. Increase in number of patients and diagnosis from 2017 to 2018 [Icelandic health insurance, personal communication, 27 January 2021].](/cms/asset/d3888f6b-d85c-418b-b9e7-05a5d86eb730/ipri_a_2097713_f0002_b.jpg)