
Figures & data
Figure 1. Number of listed patients and FITs provided in the different regions.
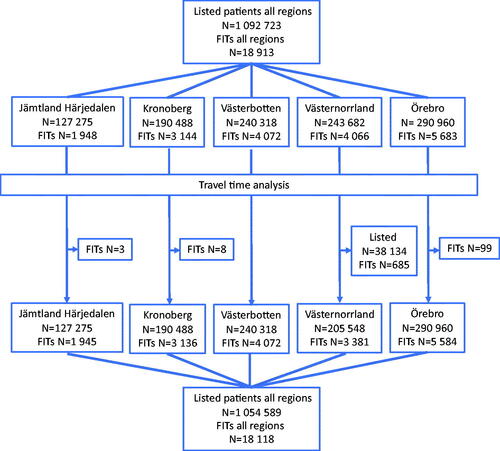
Table 1. Characteristics of the five regions included in the study.
Table 2. Number of patients that provided FITs in each region during 2015, stratified for age groups.
Figure 2. Patients’ driving times from their primary care centres to their hospital for referral, stratified for ages and the five regions.
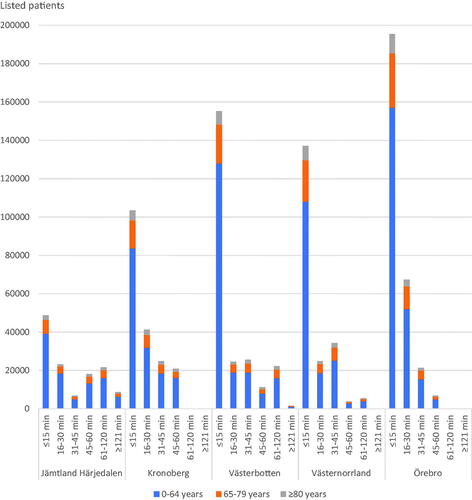
Table 3. Number of patients that provided FITs at primary care centres, grouped for driving times to specialist care and stratified for age groups.