
Figures & data
Table 1. Patient characteristics of study population, for all clinic consultations, consultations with CRP-, and consultations with RADT point-of-care test use, stratified for daytime and out-of-hours.
Figure 1. (a) Total and relative use of CRP per year, for daytime and out-of-hours primary care. Total usage is plotted as columns and relative usage as lines. (b) Total and relative use of RADT per year, for daytime and out-of-hours primary care.
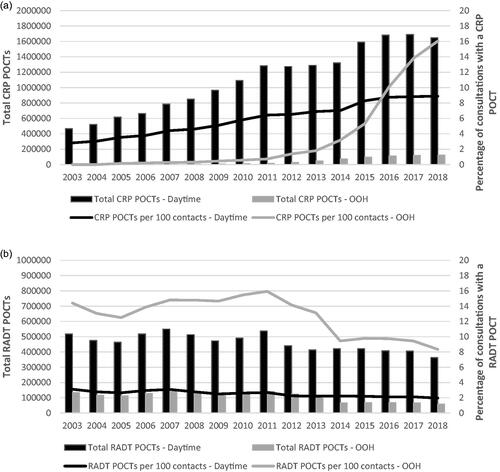
Table 2. The crude and adjusted proportion ratios (PR), after regression analyses on cluster level (i.e., provider), of CRP use for patient- and contact characteristics, stratified for daytime and out-of-hours.
Table 3. The crude and adjusted proportion ratios (PR), after regression analyses on cluster level (i.e., provider), of RADT use for patient- and contact characteristics, stratified for daytime and out-of-hours.