Figures & data
Figure 1. Development in the total number of urine samples including the distribution of positive and negative test results.
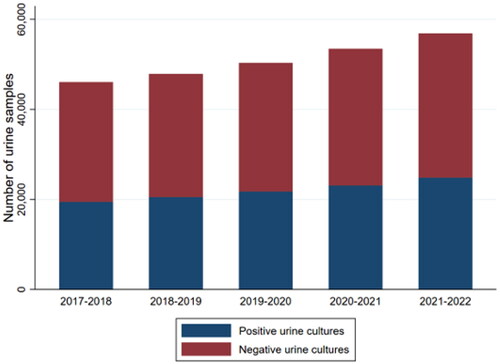
Table 1. Characteristics of the study population.
Figure 2. Distribution of urine samples within the age group and gender over the five-year period*. *Data regarding age and gender were missing for 279 urine samples ranging from 37 to 68 samples per year (data not shown).
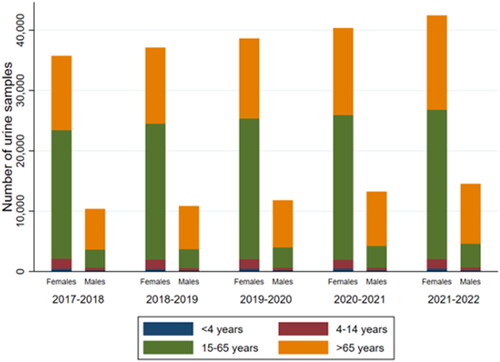
Table 2. Uropathogens identified in urine cultures from general practice.
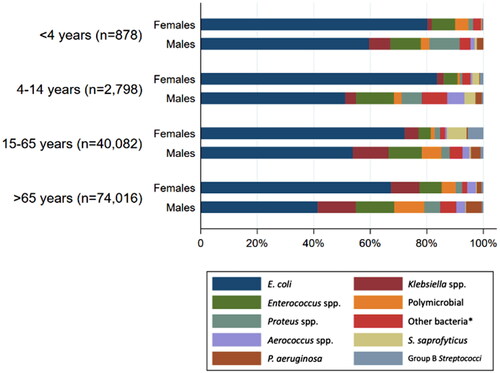
Figure 3. Distribution of uropathogens according to age group and gender. *Other bacteria were defined as species representing <1% in total.