Figures & data
Table 1. Characteristics of patients with low back pain in different healthcare settings.
Table 2. Symptoms and findings of patients with low back pain at different healthcare settings.
Table 3. Adjusted comparison of symptoms and findings of patients with low back pain at different healthcare settings.
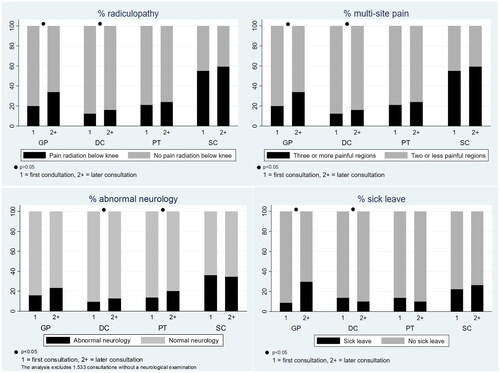
Figure 1. Severity measures of patients with low back pain who consult general practitioners, chiropractors, physiotherapists, and the spine centre at 1st and 2nd or later visit. Graph combined of four graphs, each with the groups of consultation numbers on the x-axis and showing patients with the four health professions. Y-axis 1A: Percentage radiculopathy, 1B: Percentage multisite pain. 1C: Percentage of abnormal neurology, and 1D: Percentage of sick leave. GP: General practitioner; DC: Chiropractor; PT: Physiotherapist; SC: Spine Centre.