
Figures & data
Table 1. Characteristics of Population at First Blood Sample Collection.
Figure 1. Each line represents an education group’s frequency of measurement as a percentage of the group’s total population per year.
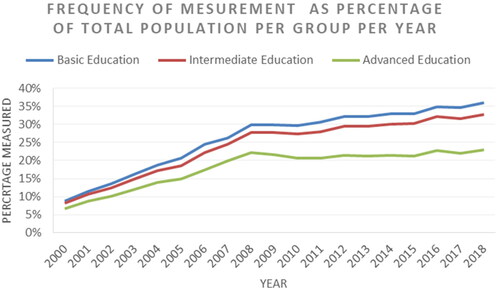
Figure 2. Each line represents an education group’s prevalence of treatment as a percentage of the total population of that group per year.
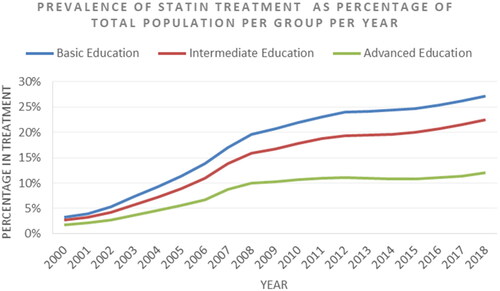
Figure 3. Each line represents the mean age a certain year of each education group at the first statin prescription an education group per year. The coloured areas represent 95% confidence intervals.
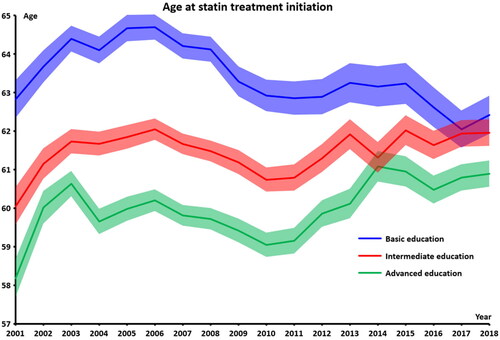
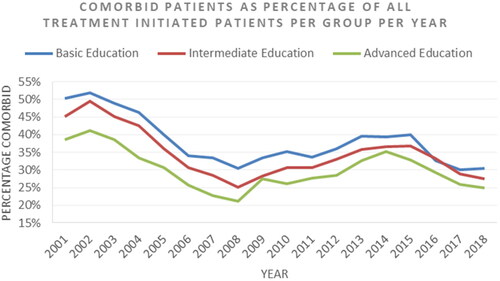
Figure 4. Each line represents an education group’s comorbidity prevalence at treatment-initiation as a percentage of all patients with new statin prescription per year.
Supplemental material