
Figures & data
Figure 1. Flow diagram of the study.
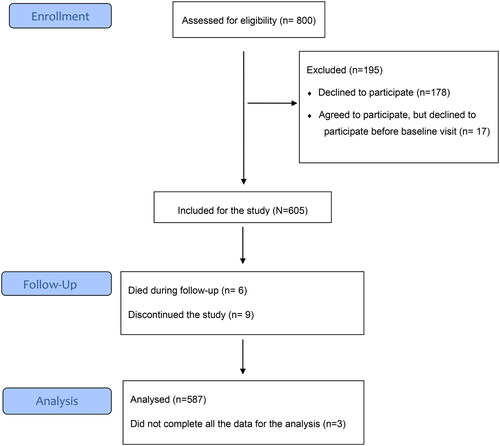
Table 1. Characteristics of the patients at baseline.
Table 2. HRQoL was measured with 15D at baseline in hypertension (H), coronary artery disease (C) and diabetes (D) groups.
Figure 2. Change in HRQoL as measured with 15D in hypertension (HA), coronary artery disease (CAD) and diabetes (DM) groups in patients having a baseline BDI score ≥10 and <10. P-values adjusted for sex, age, baseline BMI, number of diseases, education years and cohabiting.
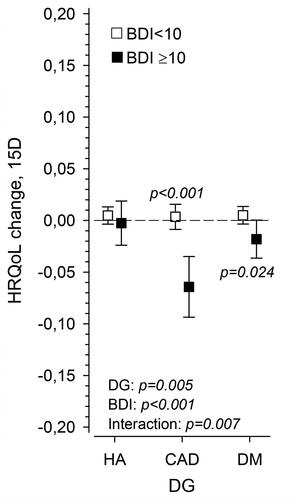
Figure 3. Presents the detailed changes in HRQoL measured with 15D according to BDI score at baseline adjusted for sex, age BMI, number of diseases, education years and cohabiting at the baseline in hypertension (HA), coronary artery disease (CAD) and diabetes (DM) groups.
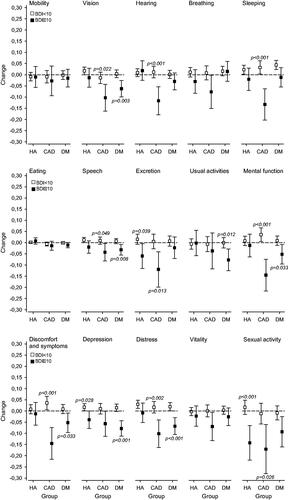
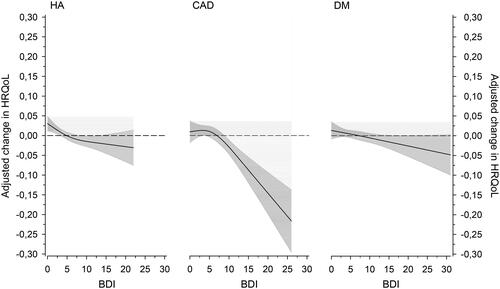
Figure 4. Relationships of adjusted change in HRQoL (15D) in three different disease groups (hypertension (HA), coronary artery disease (CAD) and diabetes (DM)) as a function of the BDI at baseline. The curves were derived from 3-knot-restricted cubic splines regression models. The models were adjusted for sex, age, baseline BMI, number of diseases, education years and cohabiting. The grey area shows the 95% confidence intervals.
Data availability statement
The datasets used and/or analysed during the current study are available from the corresponding author upon reasonable request.