
Figures & data
Figure 1. Flow chart showing the extended prenatal and childhood home visits made in this study, the national child healthcare programme in Sweden and the extended childhood home visiting programme in the Stockholm study [Citation17].
![Figure 1. Flow chart showing the extended prenatal and childhood home visits made in this study, the national child healthcare programme in Sweden and the extended childhood home visiting programme in the Stockholm study [Citation17].](/cms/asset/bb4f0739-145f-43b5-957c-7ccd9c415d40/ipri_a_2277756_f0001_c.jpg)
Table 1. Background characteristics of study and control families in a vulnerable area in Sweden.
Figure 2. Panel A the proportion of children breastfeeding in the study and control groups at the first home visit, at age 6 months and after 6 months. Panel B The proportion of mothers in the study and control group participating in follow-up check-up to maternal healthcare about two months after delivery and that used contraceptives not including condoms.
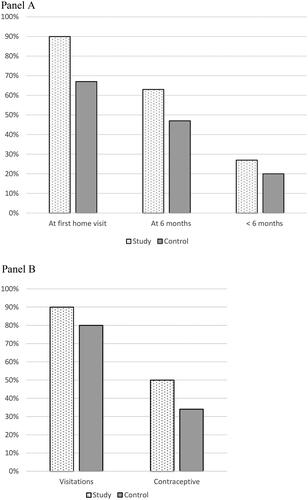
Table 2. Postnatal characteristics of study and control families in a vulnerable area in Sweden.
Table 3. Postnatal characteristics of mothers in study and control families in a vulnerable area in Sweden.