
Figures & data
Figure 1. Selection algorithm for identifying ROSA4 participants with type 2 diabetes (T2D) for the three categories of the primary outcome nominal variable.
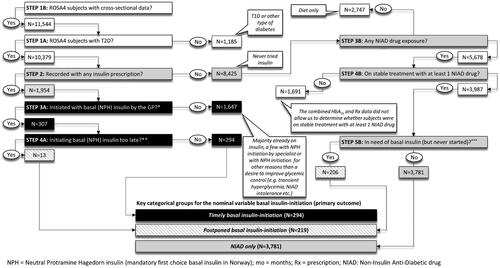
Figure 2. Descriptive overview of key health care professionals and their roles and tasks in relation to diabetes follow-up in our Norwegian general practice study.
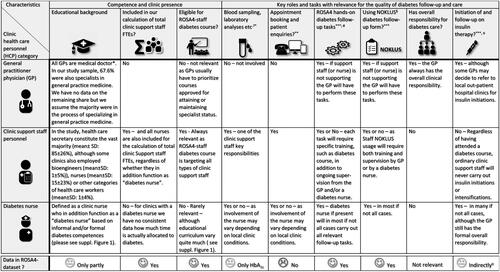
Table 1. Descriptive analysis of the characteristics of subjects with type 2 diabetes included into the three nominal study groups employed in primary outcome analysis.
Figure 3. HbA1c development in NPH (basal insulin) initiators.
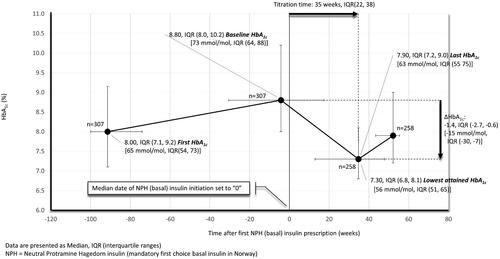
Table 2. Descriptive analysis of the characteristics of basal insulin (NPH) initiators who did or did not attain HbA1c < 7% (53 mmol/mol) (e.g. from the study sample for secondary outcome analysis).
Table 3. The relative risk ratios (RRR) and odds ratios (ORs) for the primary and secondary outcomes are shown for each key support staff factor (exposures).