
Figures & data
Figure 1. Daily new confirmed COVID-19 cases and deaths per million people from March 1st 2020 to July 19th 2021, Denmark, Finland, Norway, Sweden. (https://ourworldindata.org). Survey 1 = Survey 1 data collection period (2020). Survey 2 = Survey 2 data collection period (2021).
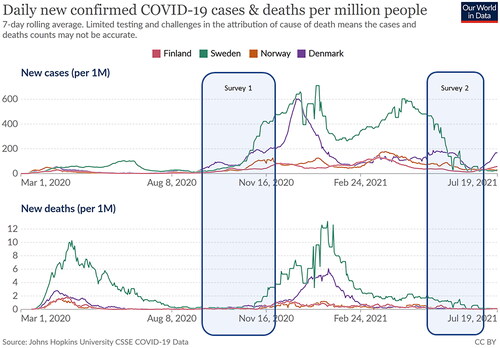
Figure 2. Perceived promotion of health and promotion of social life by country (2020 = survey 1, and 2021 = survey 2).
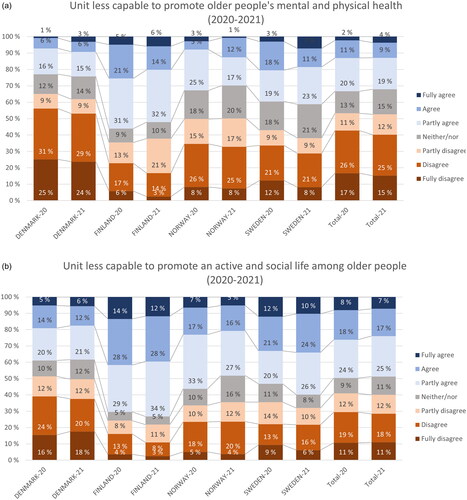
Table 1. Estimation of country-level marginal means.
Table 2. Sum of contagion cases among staff or citizens reported by managers (2020 = survey 1, and 2021 = survey 2).
Table 3. OLS regressions.
Table A1. Country-level OLS regression.
Table A2. Descriptive statistics.
Table A3. Characteristics of respondents in sample, by year and country.