
Figures & data
Table 1. Health-related and sociodemographic characteristics of patients who began the diagnostic process in general practice (n = 3411).
Table 2. Odds ratio (or) of the patients’ psychosocial experiences with the cancer diagnostic process in general practice (n = 3411).
Table 3. Odds ratio (or) for patients’ experiences with the GP during the cancer diagnostic process in general practice (n = 3411).
Table 4. Relative risk ratio (RRR)Table Footnotea of patient-perceived waiting time during the cancer diagnostic process in general practice (n = 3411).
Figure 1. Flowchart.
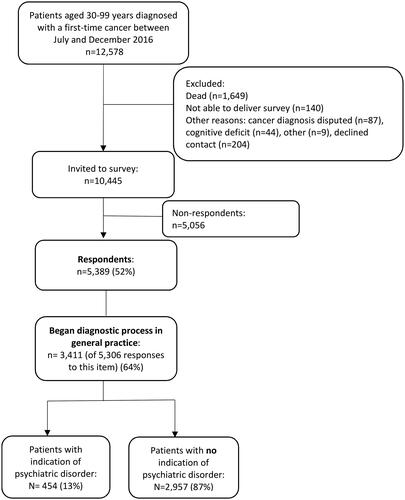
Table B1. Odds ratio (OR) of the patients’ psychosocial experiences with the cancer diagnostic process in general practice according to patients diagnosed with psychiatric disorders for up to 10 years prior to the diagnosis (n = 3411).
Table C1. Odds ratio (OR) for patient’s experience with the GP during the cancer diagnostic process in general practice according to patients diagnosed with psychiatric disorders for up to 10 years prior to the diagnosis (n = 3411).
Table D1. Relative risk ratio (RRR) of patient-perceived waiting time during the cancer diagnostic process in general practice according to patients diagnosed with psychiatric disorders for up to 10 years prior to the diagnosis (n = 3411).
Table E1. Distribution of respondents and none-respondents.
Data availability statement
The data used in this study are stored at Statistics Denmark and can only be accessed by a remote access (VPN) server, which is in line with the Danish regulations of research. Therefore, the data used in this study are not openly available.