Figures & data
Figure 1. Overview of relevant policies and instruments to urban forest governance in Scotland at national level and their translation into policies and instruments at the urban level.
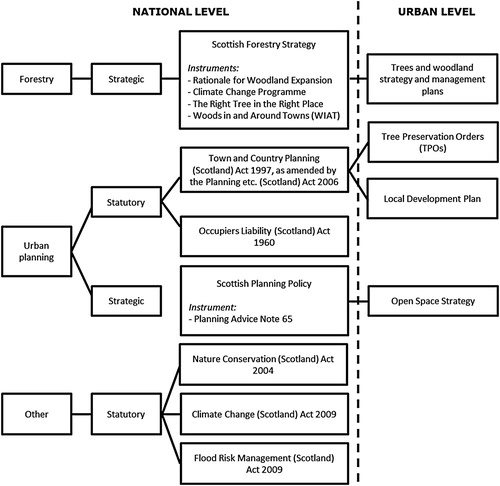
Table 1. Change in local authority (LA) trees and woodland budgets over the past five years (controlled for inflation).
Table 2. Budget per head of local authority (LA) population for management of public trees and woodlands.
Figure 2. Number of total officer full time equivalents (FTEs) allocated to the management of (urban) forest for each local authority (LA).
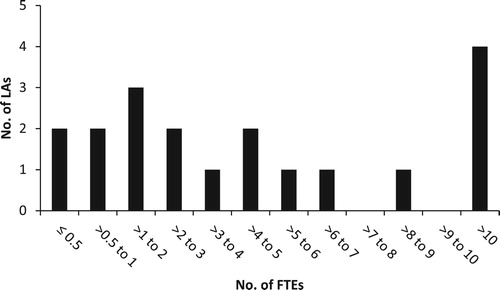
Figure 3. Percentage of total tree budget spent on contractors (incl. consultants) by different local authorities (LAs).
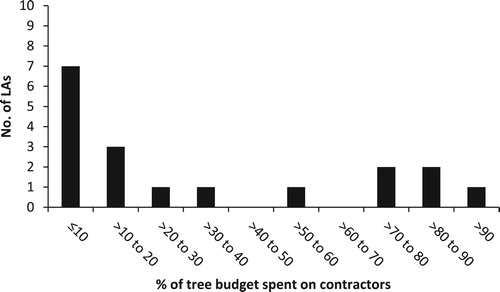
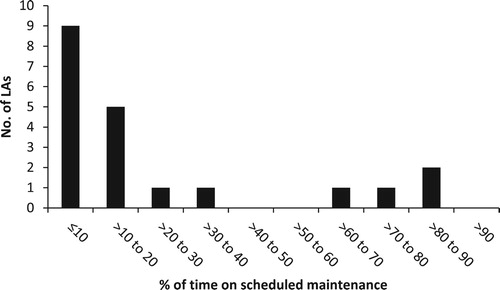
Figure 4. Percentage of maintenance work on the (urban) forest, in terms of required time, that was scheduled (as opposed to “on demand”) for each local authority (LA) at the time of surveying.