Figures & data
Figure 1. Map of experimental area. Locations of study tracks are marked with red lines. Contains data from the National Land Survey of Finland Topographic map series (raster) 10/2017.
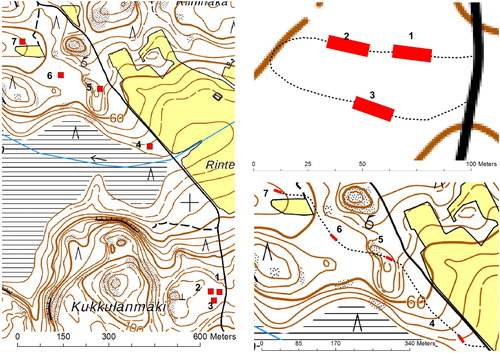
Figure 2. Particle size distribution for the study tracks.
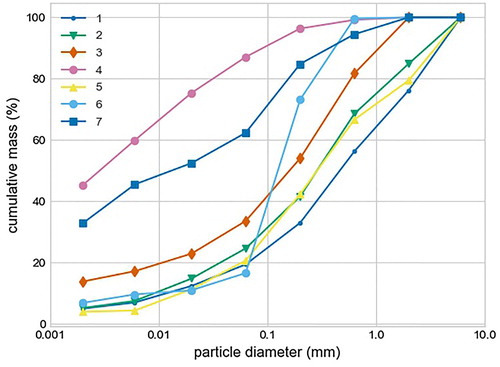
Figure 3. Average profiles of cone penetration resistance (CI) on the study tracks. Averages between 0 and 20 cm were used in the modelling.
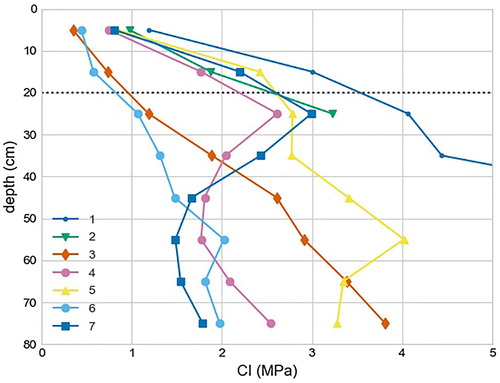
Table 1. Soil characteristics at the study tracks.
Figure 4. Average rut depths in the study tracks (1–7) after machine passes. Pass 1 = harvester (mass 22,500 kg), 2 = forwarder passes with load (mass 30,000 kg).
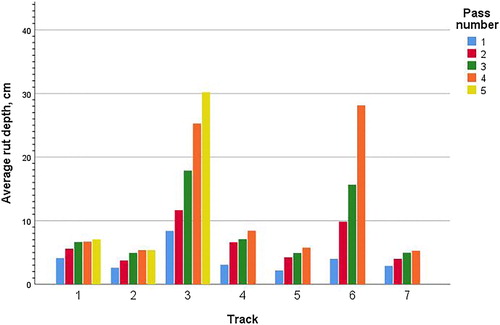
Table 2. Pearson correlation coefficients between rut depths (after one harvester pass and three forwarder passes) and soil properties calculated as averages for the test tracks.
Table 3. Mixed-linear models predicting the logarithm of the average rut depth (ln (ytmi)) of measurements in a measurement line.
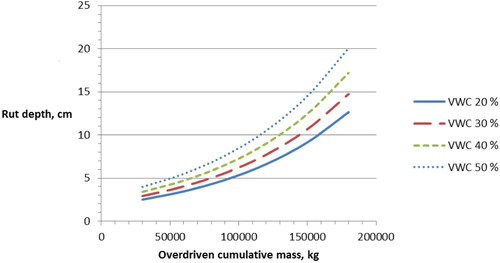
Figure 5. The influence of the cumulative overdriven mass and soil volumetric water content on the rut depth.