Figures & data
Figure 1. Measured stumps (left) marked before harvest (photo by Robert Prinz, Luke), and map (right) showing the locations of measured stumps (map by Mikko Nivala, Luke).
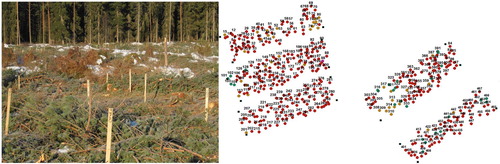
Figure 2. The New Holland Kobelco E200SR excavator (left) equipped with an Ellettari stump drill, and the Terosa KK-900 conventional stump rake (right). Photos by Raul Fernandez Lacruz, SLU, and Jaakko Mietinen, Luke, respectively.
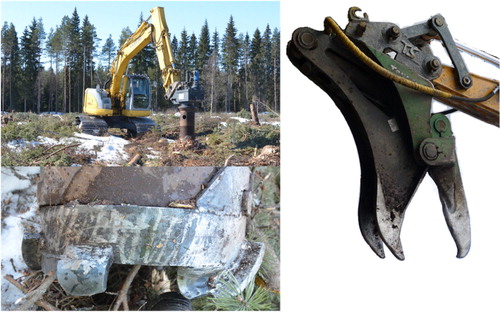
Figure 3. The net (left) used for estimating the ground disturbed area placed in position over an area disturbed by the stump rake. The rulers (right) placed over the disturbed area and hole created by the stump drill.
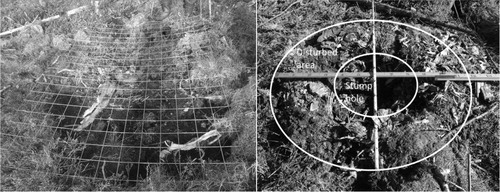
Table 1. Definitions of the work elements (Element) in the time consumption study of the stump drill.
Table 2. Summary of ANOVA to examine differences in performance between the stump rake and stump drill.
Table 3. Areas of disturbed ground and depths of holes created by the stump rake and stump drill, respectively, and sizes of the holes created by the stump drill.
Figure 4. Left: observed time consumption (s/stump) and regression line. Top right: ground disturbance in Year 0 and Year 1 created by the conventional stump rake. Bottom right: ground disturbance in Year 0 and Year 1 created by the stump drill.
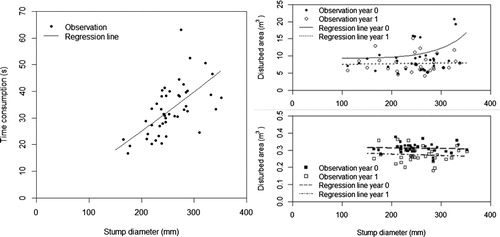
Table 4. Least squares regression functions for time consumption in seconds per stump (Time), for the stump drill (Drill), and the ground area disturbed in m2/stump (Area), in the harvest year (Year 0) and the year after harvest (Year 1) for both the stump drill and stump rake (Rake).
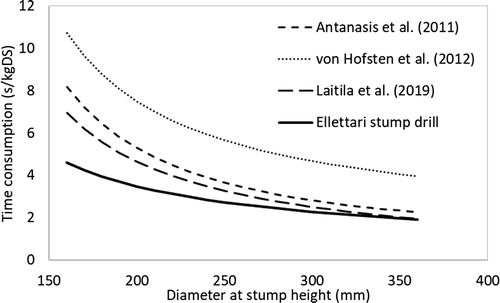
Figure 5. Estimated time consumption (s) per kg dry substance (DS) when harvesting Scots pine stumps. The DS for harvesting Scots pine stumps in the studies by Athanassiadis et al. (Citation2011), von Hofsten et al. (Citation2012), and Laitila et al. (Citation2019) was calculated according to Hakkila (Citation1972), assuming that 53% of the stump and root system was harvested by the head studied by von Hofsten et al. (Citation2012), Laitila et al. (Citation2019), and the stump drill in our study. The time consumption was assumed to be equal when harvesting Scots pine as when harvesting Norway spruce.