
Figures & data
Figure 1. Location of NFI sample plots and the stand survey, framed within the shaded study area in southern Sweden.
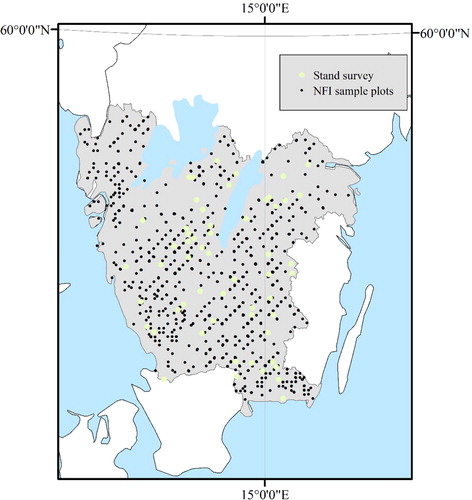
Table 1. Stand mean and standard deviation of stem density and standing volume for age categories and stand types (n = 5).
Table 2. Summary statistics of the NFI sample plots between revisions. Basal area (m2 ha−1) corresponds to the total sample plot basal area and birch proportion is the percentage birch basal area in the sample plot.
Figure 2. Box and whisker plot of the birch proportion in basal area (%) in each sample plot, grouped by stand age at the time of the revision. The number of observations is stated (with n = j) in red above the stand age presented in black, in age classes of 10 years where “20” corresponds to age 16–25, etc.
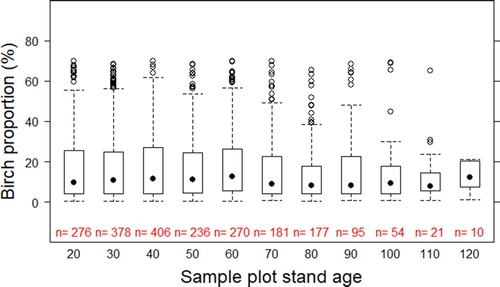
Figure 3. Box and whisker plot of the ratio of birch vs Norway spruce quadratic mean diameter in each sample plot, grouped by stand age at the time of the revision. The number of observations is stated (with n = j) in red above the stand age presented in black, in age classes of 10 years where “20” corresponds to age 16–25, etc.
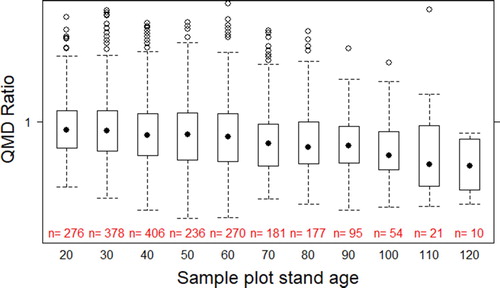
Table 3. Statistical characteristics of Equation (1).
Figure 4. Visualization of the composition and the canopy structure in plots (left panel) and as mean values over stands (right panel). The combination of colour and symbol is representing a unique stand.
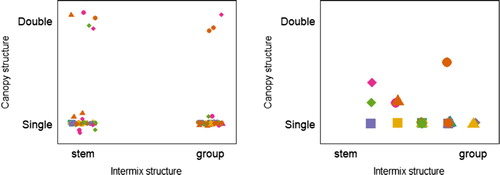
Figure 5. Top panel: Sample plot basal area vs the mean basal area for the five sample plots. Each line corresponds to the min and max value from each stand. Lower panel: Coefficient of variance of basal area between sample plots in the same stand. Dark grey and light grey symbols correspond to Norway spruce monoculture and birch stand, respectivley.
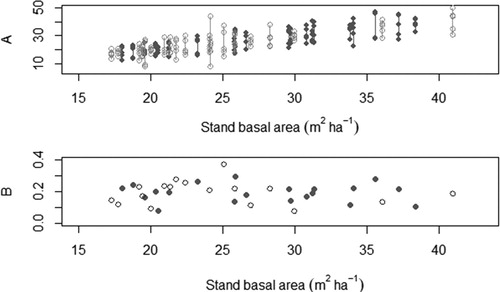
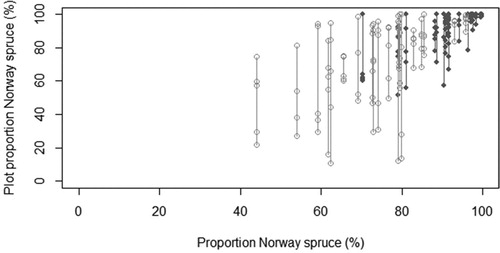
Figure 6. The basal area proportion (%) of Norway spruce in sample plots vs the stand mean value. Lines correspond to the stand max and min value. Dark grey and light grey symbols correspond to Norway spruce monoculture and birch stand, respectively.
Data availability
Data from the national forest inventory (NFI) are open source and available from the SLU webpage: https://www.slu.se/en/Collaborative-Centres-and-Projects/the-swedish-national-forest-inventory/. Detailed information regarding exact coordinates of sample plots from both stand survey and NFI is not open source but may be retrieved after written agreements have been made with the original data supplier. The datasets generated during and/or analysed during the current study are available from the corresponding author on reasonable request (excluding exact location of the plots).