Figures & data
Table 1. List of products tested.
Table 2. Experiment site details.
Table 3. Experimental treatments at Headley Research Enclosure (Experiment 1), and Unicorn Knowe, Kielder (Experiment 3).
Table 4. Experimental treatments at Headley Research Enclosure (Experiment 2).
Table 5. Experimental treatments at Binky Burn and Wainhope Linn, Kielder Forest (Experiment 4).
Table 6. Experimental treatments at Stourcleugh, Spadeadam Forest (Experiment 5).
Figure 1. Transplant status after one growing season at Headley Research Enclosure, Experiment 1. Notes: (A) Distribution of tree health scores (THS) (1 = healthy; 5= dead) and (B) height growth increment (cm) for Sitka spruce transplants planted in December 2014 (0 months storage), January 2015 (1.5 months storage) or March 2015 (3 months storage) and treated with alpha-cypermethrin, acetamiprid, or a Kvaae® wax barrier coating. For health score data, lettering indicates significant differences in proportion of trees with THS of 1/ 2 versus 3/4/5. For height growth data, lettering indicates significant differences in height growth across all treatments (corrected for multiple comparisons). Error bars = 95% confidence intervals (uncorrected).
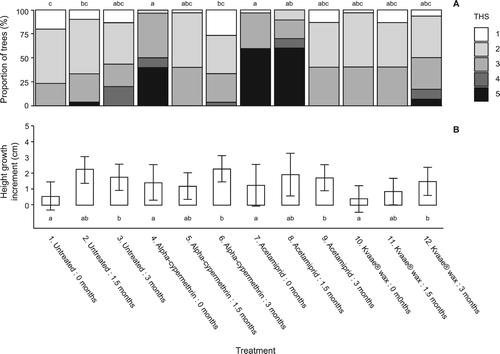
Figure 2. Transplant status after one growing season at Headley Research Enclosure, Experiment 2. Notes: (A) Distribution of tree health scores (THS) (1 = healthy; 5= dead) and (B) height and root collar diameter (RCD) growth (cm) for transplants treated with Kvaae® wax coating covering 0%, 50%, 75% and 100% of the length of the stem. For health score data, lettering indicates significant differences in proportion of trees with THS of 1/2 versus 3/4/5. For growth data, lettering indicates significant differences in height and RCD growth within each species/size combination (corrected for multiple comparisons). Error bars = 95% confidence intervals (uncorrected). Species codes are: QSS, Sitka spruce (seed orchard); VPSS, Sitka spruce (vegetatively propagated); NS, Norway spruce; WRC, western red cedar; DF, Douglas fir; SP, Scots pine; OK, pedunculate oak.
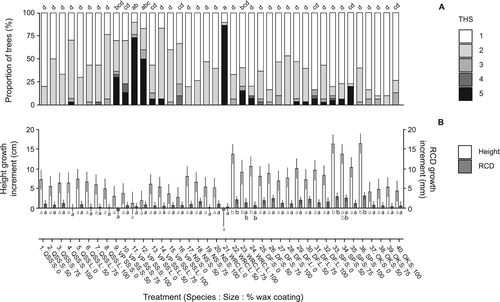
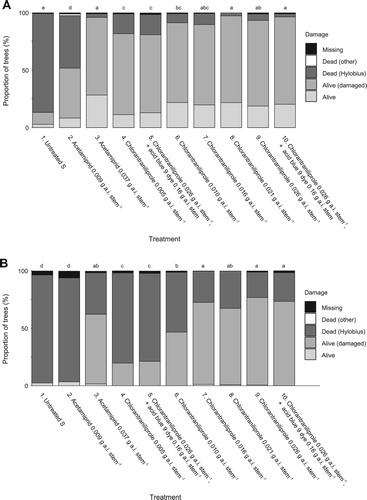
Figure 3. (A) Transplant status after one growing season at Unicorn Knowe, Kielder Forest in 2015, Experiment 3. Notes: Sitka spruce transplants planted in December 2014 (0 months storage), January 2015 (1.5 months storage) or March 2015 (3 months storage) and treated with alpha-cypermethrin, acetamiprid, or a Kvaae® wax barrier coating. Lettering indicates a statistical difference in the proportion of treatment survival (alive/alive (damaged) versus dead (Hylobius), corrected for multiple comparisons (note: tested at the treatment level, as there was no significant treatment : storage interaction). Other mortality and missing transplants were excluded from the statistical analysis. (B) Transplant status after two growing season at Unicorn Knowe, Kielder Forest in 2016, Experiment 3. Notes: Transplants were planted and treated as for a. Lettering indicates a statistical difference in the proportion of treatment survival (alive/alive(damaged) versus dead (Hylobius), corrected for multiple comparisons (note: tested at the treatment level, as no significant treatment : storage interaction). Other mortality and missing transplants were excluded from the statistical analysis.
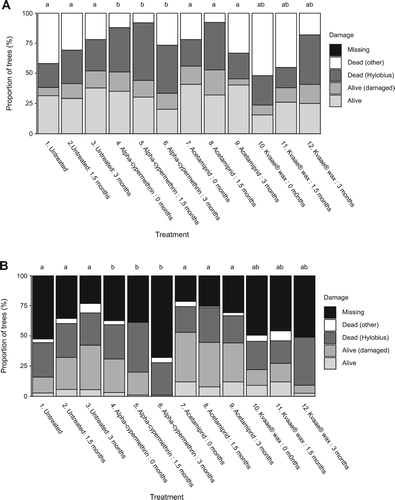
Figure 4. (A) Transplant status at Binky Burn and Wainhope Linn, Kielder Forest in mid-2014, Experiment 4. Notes: Transplant status including damage caused by Hylobius, across 25 treatments. Lettering indicates a statistical difference in the proportion of treatment survival (alive/alive(damaged) versus dead (Hylobius)); * = significant difference to active control (p < 0.05; grouped mean of treatment 3, Alpha-cypermethrin small size class, and treatment 4, alpha-cypermethrin large size class); † = significant difference to untreated control (p < 0.05; grouped mean of treatments 1 and 2). Other mortality and missing transplants were excluded from the statistical analysis. Treatment effects were consistent across sites, with main effect of site only (% dead due to Hylobius greater overall at Binky Burn). (B) Transplant status at Binky Burn and Wainhope Linn in mid-2015, Experiment 4. Notes: Transplant status including damage caused by Hylobius, across 13 of 25 treatments (for reasons of economy it was not possible to reassess all treatments, and so the decision was taken to focus only on those which included acetamiprid). Lettering indicates a statistical difference in the proportion of treatment survival (alive/alive (damaged) versus dead (Hylobius)); † = significant difference to untreated control (p < 0.05; grouped mean of treatments 1 and 2). Other mortality and missing transplants were excluded from the statistical analysis. Treatment effects were consistent across sites, with main effect of site only (% dead due to Hylobius greater overall at Binky Burn).
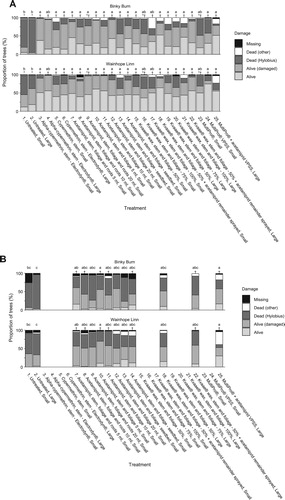
Figure 5. (A) Transplant status after one growing season at Stourcleugh, Spadeadam Forest, in 2016, Experiment 5. Notes: Lettering indicates a statistical difference in the proportion of treatment survival (alive/alive (damaged) versus dead (Hylobius), corrected for multiple comparisons. Other mortality and missing transplants were excluded from the statistical analysis. (B) Transplant status after two growing seasons at Stourcleugh, Spadeadam Forest, in 2017, Experiment 5. Notes: Lettering indicates a statistical difference in the proportion of treatment survival (alive/alive (damaged) versus dead (Hylobius), corrected for multiple comparisons. Other mortality and missing transplants were excluded from the statistical analysis.