Figures & data
Figure 1. An example plot (left) and a schematic illustration (right) of the half-height calculation based on the two tallest trees (right) in an Äbin inventory.
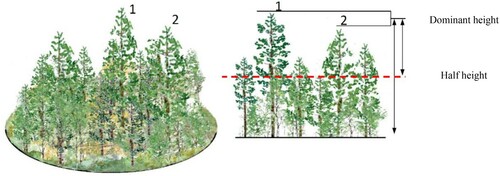
Figure 2. Äbin inventory stands located in northern, southern and central Sweden. Each dot represents the location of each stand and boundaries show the division of different regions.
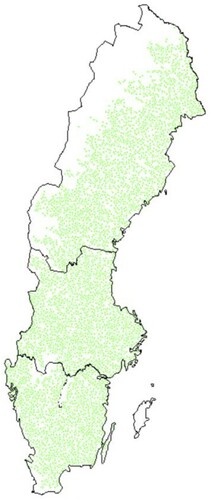
Figure 3. Species used in regeneration and area coverage by each species in different regions of Sweden.
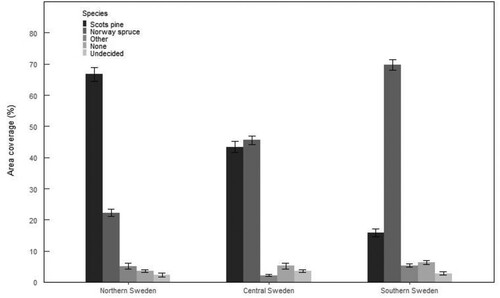
Figure 4. Spatial distribution of species used in the regeneration of Swedish forests. The map shows the proportion of total conifer and both Norway spruce and Scots pine used in different regions of Sweden in regeneration. The different colour of the scale shows different proportion of species, for example dark green represents 81-100% of species used in regeneration.
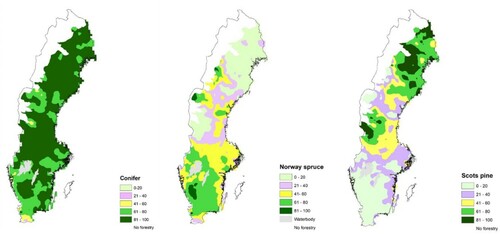
Figure 5. Area coverage of different stem number classes by regeneration species: (a) Scots pine in stands regenerated with Scots pine and (b) Norway spruce in Norway spruce regenerated stands.
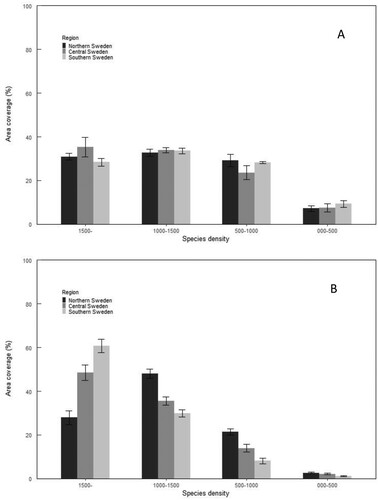
Figure 6. Spatial distribution of Scots pine (upper figures) and Norway spruce (lower figures) dominated stands when 1000 and 1500 TPH of the respective tree species was considered as the definition of dominance.
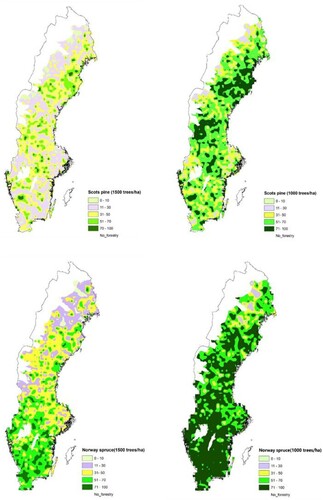
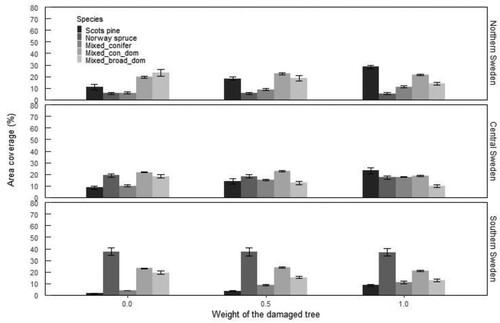
Figure 7. Species composition of young forest in Sweden as a function of damaged tree weighting. The bars show the proportion of area with more than 1500 TPH in each species composition class. In the species composition classes, the respective species alone or together made up more than 1500 TPH (see Materials and Methods for further description of species composition classes).