Figures & data
Figure 1. Functions for calculating modifiers used to adjust incoming radiation (PAR) values according to the following monthly variables. a) vapour pressure deficit (VPD). b) mean monthly temperature (°C) by species. c) soil water ratio (soil water balance (mm) (S) divided by the potentially available soil water (mm) (Φ) (see equation 10). d) number of frost days in a month.
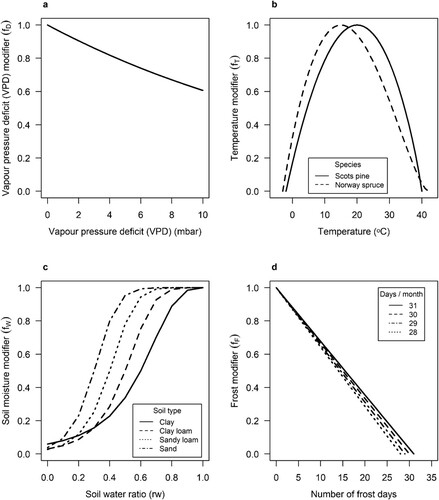
Figure 2. Residuals of the fitted mensurational time-based model (a) and the hybrid model (Hybrid-TFDW) (b) for Scots pine. Residuals from the validation of the mensurational time-based model (c) and the hybrid model (Hybrid-TFDW) (d). The thick lines show the trend in the residuals.
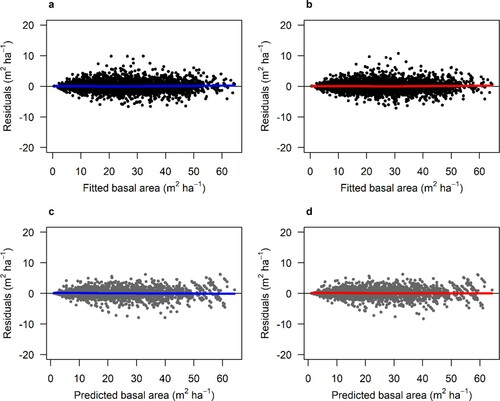
Figure 3. Residuals of the fitted mensurational time-based model (a) and the hybrid model (Hybrid-TFDW) (b) for Norway spruce. Residuals from the validation of the mensurational time-based model (c) and the hybrid model (Hybrid-TFDW) (d). The thick lines show the trend in the residuals.
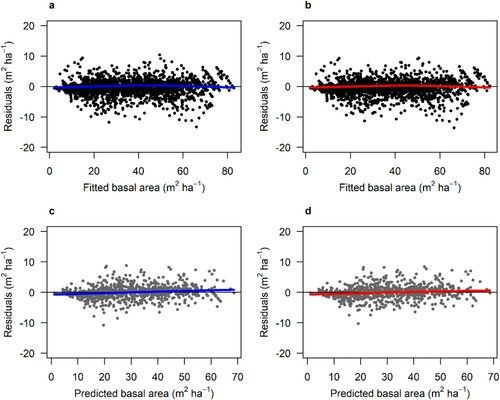
Table 1. Variables and parameters used in the climate modifier calculations.
Table 2. Estimated parameters for the fitted basal area models and their standard errors (SE) and model fit and validation RMSE (m2 ha−1). Time-based (Equation 1) = mensurational model using time as driving variable. Hybrid (Equation 2) = unmodified PULS, Hybrid-D = modified by VPD, Hybrid-W = modified by soil water, Hybrid-T = modified by temperature, Hybrid-F = modified by frost, and Hybrid-TFDW = all four modifiers included. All estimated parameters were significant (p-value < 0.05).
Figure 4. 140 randomly selected NFI plots, a) yearly radiation sum (MJ m−2) over the measurement period for unmodified PULS (MJ m−2; blue line), and PULS modified by temperature (PULSfT; red line). b) yearly mean temperature (°C) at the same sites. The black lines show linear trends.
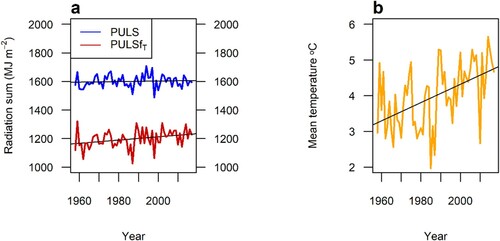
Figure 5. Average effect for July of temperature and precipitation changes on the soil water modifier (fW) during a 20-year simulation with altered input climate data. The dots represent randomly selected permanent sample plots from the Swedish NFI. The panels show scenarios of: (a) current climate, (b) temperature increased by 4 °C, (c) precipitation increased by 20%, and (d) precipitation increased by 20% and temperature increased by 4 °C.
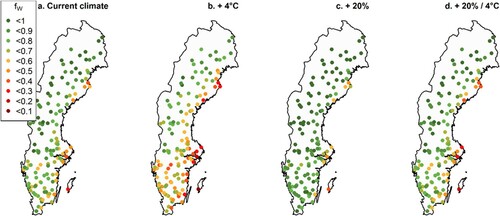
Figure 6. Relative change of basal area (%) after a 20-year simulation with altered input climate data compared with current climate. The different scenarios tested were increased monthly precipitation by either 10% or 20%, increased monthly temperatures by either 2 °C or 4 °C, and all four combinations of increased temperature and precipitation. All scenarios, except for the 2 °C warming scenario at current precipitation for Norway spruce, were significantly different (p-value < 0.05) from the unaltered climate scenario.
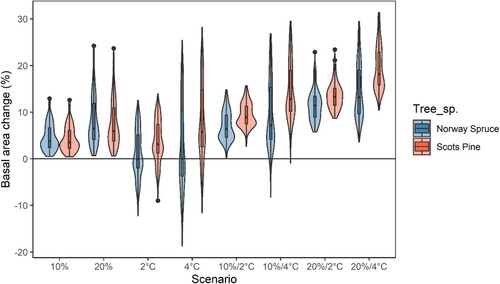
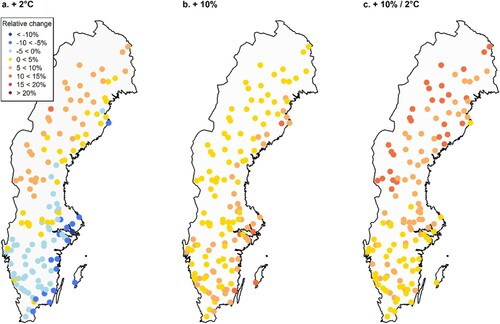
Figure 7. Relative change in basal area change (%) after a 20-year simulation with altered input climate data compared with current climate using the hybrid Scots pine model containing all modifiers (Hybrid-TFDW). The dots represent 140 randomly selected permanent sample plots from the Swedish NFI. Scenarios: (a) = increased temperature increased by 2 °C, (b) = increased precipitation increased by 10%, and (c) = increased precipitation increased by 10% and increased temperature increased by 2 °C.
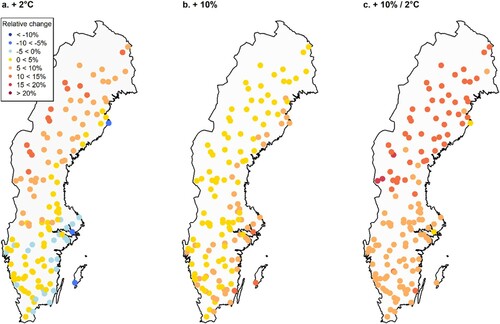
Figure 8. Relative change in basal area change (%) after a 20-year simulation with altered input climate data compared with current climate using the hybrid Norway spruce model containing all modifiers (Hybrid-TFDW). The dots represent 140 randomly selected permanent sample plots from the Swedish NFI. Scenarios: (a) = increased temperature increased by 2 °C, (b) = increased precipitation increased by 10%, and (c) = increased precipitation increased by 10% and increased temperature increased by 2 °C.