
Figures & data
Figure 1. Map of Finland divided into vegetation zones: lightest shade – boreonemoral and southern boreal; middle shade – middle boreal; and darkest shade – northern boreal from south to north [Bio-geographical regions / Source: Finnish Environment Institute].
![Figure 1. Map of Finland divided into vegetation zones: lightest shade – boreonemoral and southern boreal; middle shade – middle boreal; and darkest shade – northern boreal from south to north [Bio-geographical regions / Source: Finnish Environment Institute].](/cms/asset/c55f9969-178f-4d2a-b401-7b8a11048a2b/sfor_a_2229732_f0001_oc.jpg)
Figure 2. Simulation setup: area allocation and data (NFI sample plots, Scenarios, Targeting of protection and nature maintenance management, Initial data of EFDM model in 2016, Forest management regimes); components of the EFDM and simulation (EFDM model, Target harvest level, Matrices 1—3, Simulation 5-year time steps); and results (Areas in 2016—2051, Converting area with result coefficients and Results ).
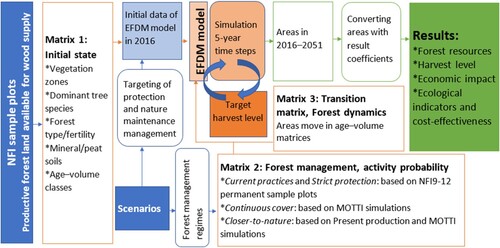
Figure 3. (a) Allocation of productive forests currently available for wood supply to different management regimes, and (b) initial age distribution of area in 2016 in scenarios BAU, Double, and All.
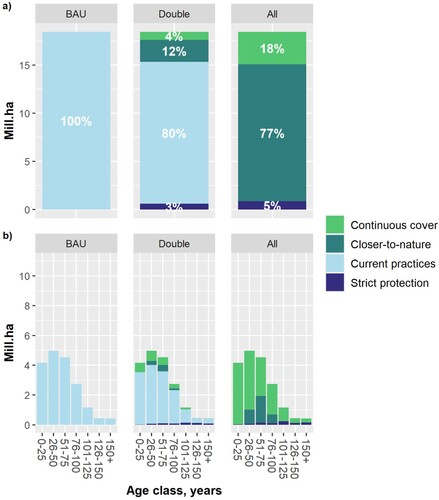
Table 1. Allocation of productive forest land available for wood supply to different forest management regimes in different management scenarios by boreal vegetation zones and total.
Table 2. Criteria for selecting strict protection in scenarios by vegetation zones and forest site types, defined either by age (AGE) or diameter at breast height (DBH).
Table 3. Stumpage prices of sawlogs and pulpwood (€/m3) linked to management activities.
Figure 4. Results for current harvest level simulations: (a) volume of cutting removal; (b) total growing stock volume; (c) forests’ age distribution in 2051; and (d) area of treatments for scenarios: BAU (Business-as-Usual), Double (double the current strict protection in the South, extent of protection 20% of land area, but no changes in the northern boreal vegetation zone), and All (protection cover entire area) by five-year simulation steps.
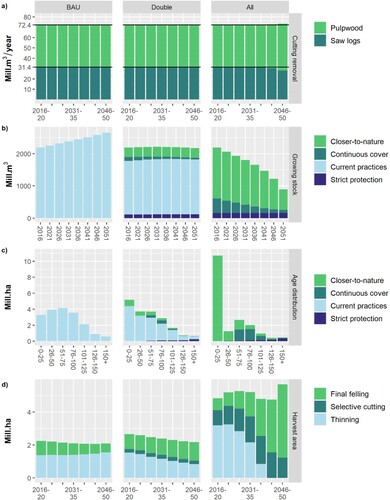
Figure 5. Results for maximum sustained harvest level simulations: (a) volume of cutting removal; (b) total growing stock volume; (c) forests’ age distribution in 2051; and (d) area of treatments for scenarios: BAU (Business-As-Usual), Double (double the current strict protection, extent of protection 20% of land area, but no changes in northern boreal vegetation zone), and All (protection cover entire area) in five-year simulation steps.
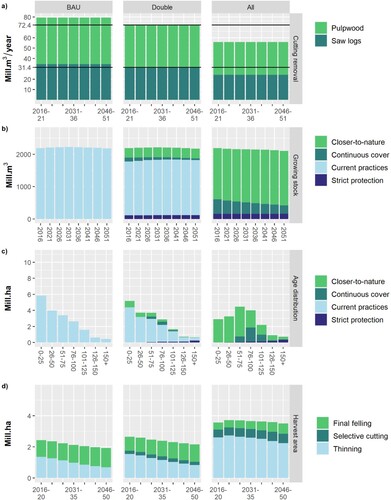
Table 4. Net present value of scenarios with different interest rates and harvest levels in billions of euros.
Table 5. Values of ecosystem service indicators at the initial state in 2016 and in the end of the simulation in 2051, when scenarios were run at current or scenario-specific maximum sustained harvest levels.
Table 6. Cost-effectiveness indices (Indicator unit/billion euros) for ecosystem service at current and scenario-specific maximum sustained harvest levels with an interest rate of 3%.
Data availability statement
The data that support the findings of this study are available from the corresponding author, M. R., upon reasonable request.