
Figures & data
Figure 1. Positions of cavity-bearing trees ♦ (n = 215) and nest boxes ● (n = 236) in the study area located in Southwest Finland. The numbers on the symbols denote the aggregated counts of respective cavity types. The background map depicts the main land cover classes which were derived from a modified Corine Land Cover 2018 raster (SYKE Citation2021).
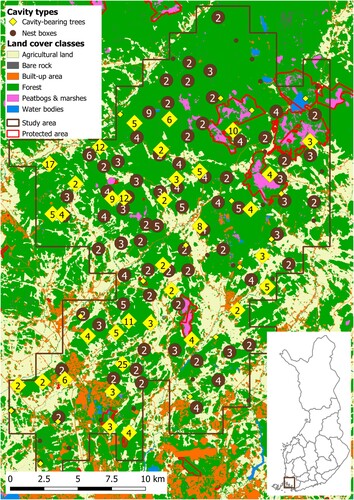
Table 1. Mean ± SE and range (min – max) of values of forest structure parameters in 25 m buffer around the cavity-bearing trees (retention trees n = 42, forest edge n = 75, forest interior n = 103) and nest boxes (n = 236). Pine_fol = mean pine foliage biomass (t.ha−1), spruce_fol = mean spruce foliage biomass (t.ha−1), dec_fol = mean deciduous trees foliage biomass (t.ha−1), height = mean stand tree height (m), diam = mean stand tree diameter (cm), canopy = mean canopy coverage (%), canopy_dec = mean canopy coverage of deciduous trees (%), pine_vol = mean growing stock volume of pine (m3.ha−1), spruce_vol = mean growing stock volume of spruce (m3.ha−1), dec_vol = mean growing stock volume of deciduous trees (m3.ha−1), basal = mean stand basal area (m2.ha−1), age = stand age (years).
Figure 2. Ordination plots depicting the relationships between the forest parameters along PC1, PC2, PC3 and PC4 gradients of forest structure in 2017. Abbreviations: Pine_fol = mean amount of pine foliage biomass, spruce_fol = mean amount of spruce foliage biomass, dec_fol = mean amount of deciduous tree foliage biomass, height = mean stand tree height, diam = mean stand tree diameter, canopy = mean canopy coverage, canopy_dec = mean canopy coverage of deciduous trees, pine_vol = mean growing stock volume of pine, spruce_vol = mean growing stock volume of spruce, dec_vol = mean growing stock volume of deciduous trees, basal = mean stand basal area, age = mean forest stand age. For ordination plots across all the years see Fig. S2.
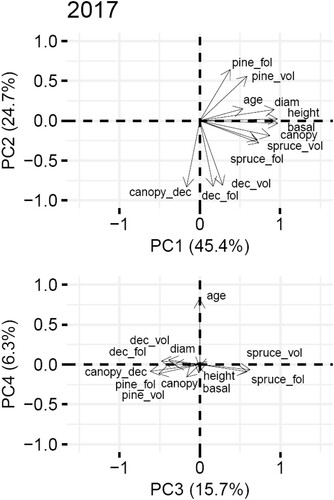
Table 2. The final models relating the occupancy (Occ) to parameters of forest structure around cavity-bearing trees and nest boxes (cavity type). For all species altogether we fitted model 1 only, while for the combination of great and blue tits we fitted all listed models. All models also included exponential covariance structures as spatial autocorrelation terms.
Table 3. Species breeding in the excavated cavities (cavity-bearing trees, n = 215) and nest boxes (n = 236) in the study area, the number of nests found, and mean species’ occupancy rates in the cavity types. Parus = undetermined, either great or blue tit nest.
Figure 3. The probability of occupancy of cavity-bearing trees recognized as retention trees (n = 42), forest edge trees (n = 75), and forest interior trees (n = 103) and of nest boxes (n = 236) being occupied by (a) any cavity nesters and (b) by great and blue tits in managed boreal forests of SW Finland in 2017-2021. Error bars depict 95% CIs.
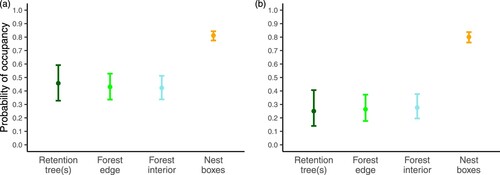
Table 4. Conditional effects of forest structure parameters on the occupancy of cavity-bearing trees (recognizing cavities in retention trees, forest edge, and forest interior) and nest boxes in buffers of (a) 25 m and (b) 50 m around the respective cavity types. Model numbers correspond with the numbering in . For full model outputs see Table S5a. Statistically significant effects (p < 0.05) are in bold.
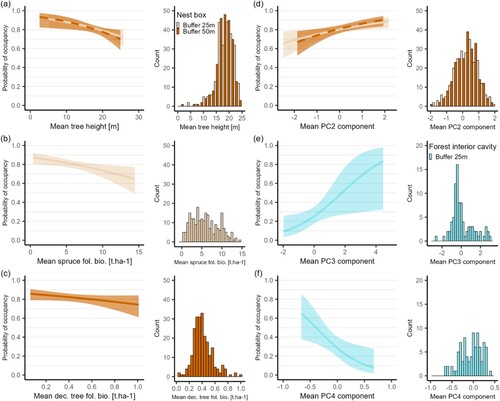
Figure 4. Statistically significant relationships between the probability of occupancy of the nest boxes and cavity-bearing trees and forest structure parameters estimated within 25 and 50 m buffers: (a) tree height, (b) amount of spruce foliage biomass, (c) amount of deciduous tree foliage biomass, (d) forest structure determined by PC2 (a gradient from deciduous tree dominated to pine-dominated stands), (e) forest structure determined by PC3 (a gradient from non-spruce to spruce stands), and (f) forest structure determined by PC4 (a gradient from young to old stands). Histograms show the counts of nest boxes and cavity-bearing trees at specific values of respective forest structure parameters.
Supplemental Material
Download MS Word (544.2 KB)Data availability statement
The data that support the findings of this study are available from the corresponding author, JH, upon reasonable request.