
Figures & data
Figure 1. Map showing locations of the assessed stands in Norway, colors indicating the seven contractors that provided the harvester data.
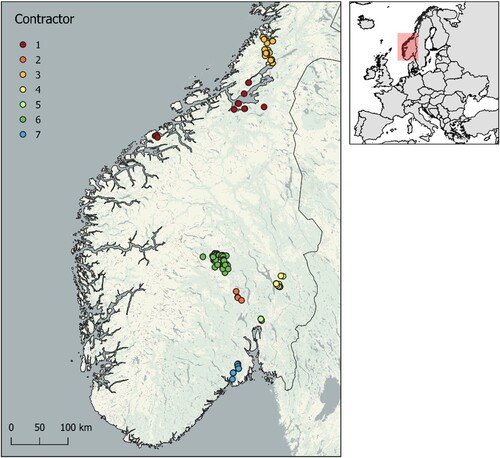
Table 1. Summary statistics of diameters at breast height (DBH) and tree volumes under bark (including cut-offs/waste) recorded by the harvesters, and tree values according to the assumed assortment prices () for the harvested Norway spruce trees (n = 385,766).
Table 2. Norway spruce log assortments used in the bucking simulations, assumed prices (€/m3 under bark), and permitted log dimensions (over bark).
Figure 2. Density plot of diameters at breast height (DBH) of trees without butt rot and trees with butt rot. Rotten and non-rotten are here considered different populations.
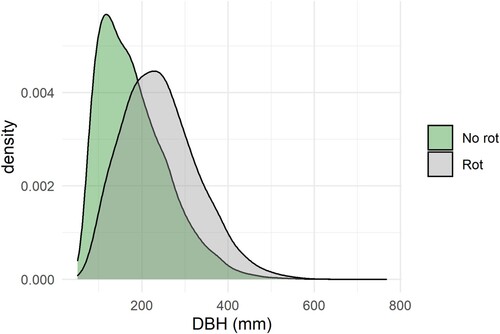
Table 3. Proportions of log assortments obtained from the bucking simulations.
Figure 3. Diameter at breast height (DBH) of harvested trees plotted against value losses.
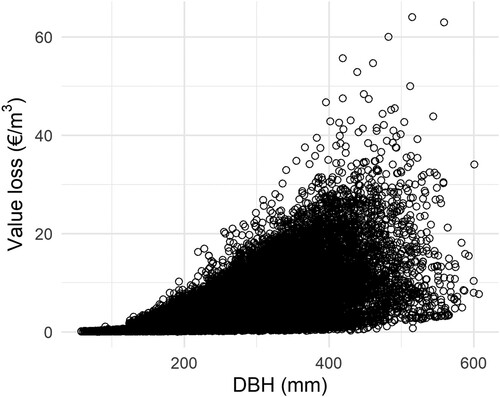
Figure 4. Violin plot of value losses of trees affected by rot. Dots indicate mean values calculated for contractors and whiskers indicate corresponding standard deviations.
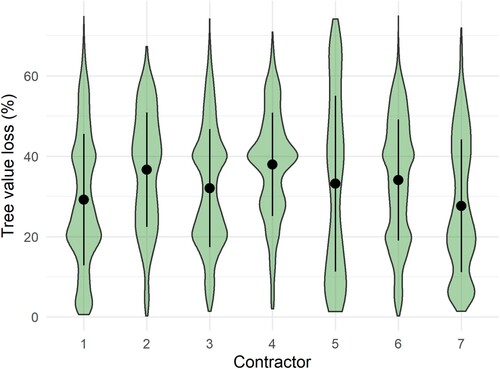
Figure 5. Density plots of saw log volume losses in percent of total tree volume (left panel) and in m3 (right panel), obtained for trees affected by butt rot. Dashed lines indicate mean values.
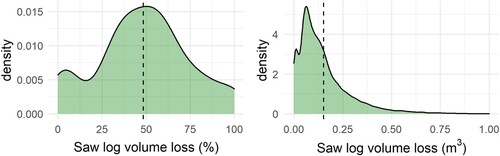
Table 4. Number of trees, mean value loss per tree, mean saw log length and no. of saw logs per tree obtained in the simulations, calculated for five diameter at breast height (DBH) classes.
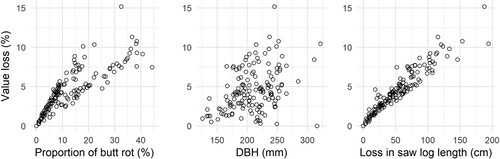
Figure 6. Stand-wise mean value losses plotted against mean proportions of butt rot, mean diameter at breast height (DBH) and mean loss in saw log length obtained for the harvested stands.
Data availability statement
For privacy reasons, the contractors and forest owners’ cooperatives that own the harvester data did not agree for the data to be shared publicly.