
Figures & data
Figure 1. The distribution of (A) the survey sample nodes over Sweden, illustrated by (B) sites within the sample node, and (C) sample plots on one of the sites.
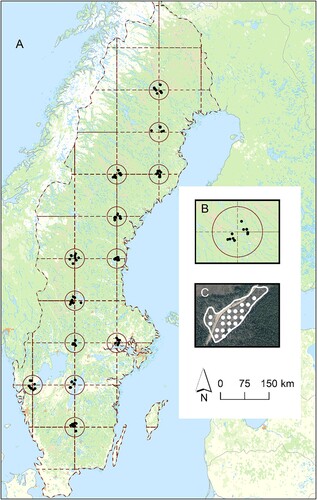
Table 1. List of regional climate features that were tested in the linear model Equation (1).
Figure 2. Five-year mean stem density in Sweden’s young forests between 1985 and 2019 for each tree species and all species combined: the shaded area shows standard deviation.
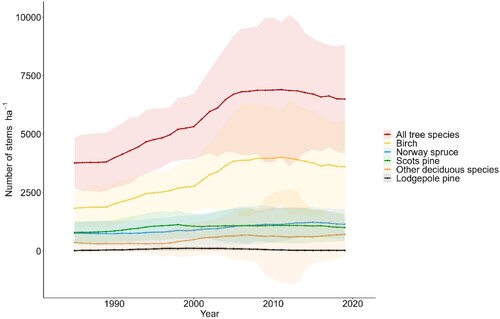
Figure 3. Five-year mean of standing volume in Sweden’s young forests between 1985 and 2019 for each tree species and all species combined: the shaded area shows standard deviation.
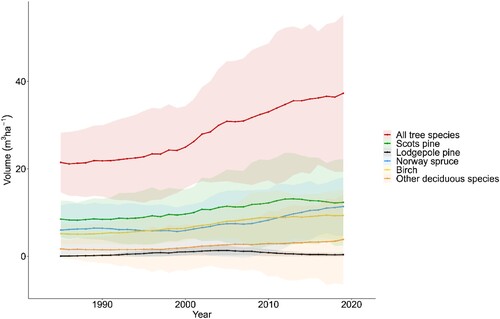
Figure 4. Clearfelled area between 1957 and 2019, and area of young forest between 1975 and 2019, for Sweden´s northern, middle and southern parts, in five-year means from the Swedish NFI. Y-axis with differing scales. Young forest is defined as the NFI classifications B2 (plots with an average height between 1.3 and 3 m) and B3 (plots with an average height over 3 m, with several dominating and co-dominant trees of less than 10 cm in diameter). Northern Sweden includes the counties: Norrbotten, Västerbotten, Jämtland, Västernorrland and Gävleborg. Middle Sweden includes: Dalarna, Värmland, Örebro, Västmanland, Uppsala, Södermanland, Stockholm. Southern Sweden includes: Västergötland, Östergötland, Gotland, Jönköping, Kalmar, Halland, Kronoberg, Blekinge, Skåne.
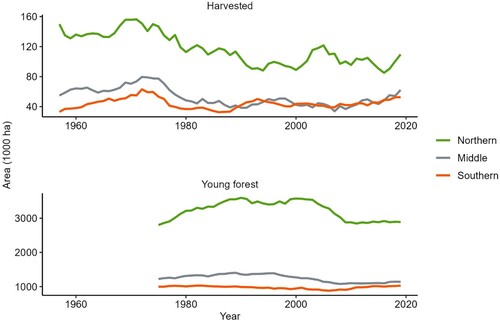
Table 2. Summary output from a Wilcoxon matched-pairs test comparing five-year means of area of young forest between 1983–1987 and 2017–2021, using Sweden’s 21 counties as sampling units, and summary outputs of Wilcoxon rank sum (Mann-Whitney) tests comparing the yearly area weighted stem density and volume of Sweden’s young forests between the periods 1983–1987 and 2017–2021, for all species combined.
Figure 5. Panel A. The proportion of silver birch (Betula pendula) and downy birch (Betula pubescens) seedlings in stem numbers per region, moving north to south. Total number of birches found in each region is given to the right of each bar. Panel B. The proportion of silver birch (Betula pendula Roth) and downy birch (Betula pubescens Ehrh.) for the tallest seedling on each plot, for each region: A, Jokkmokk; B, Piteå; C, Vindeln; D, Åsele; E, Sollefteå; F, Hudiksvall; G, Sveg; H, Mora; I, Storfors; J, Västerås; K, Skövde; L, Trollhättan; M, Växjö.
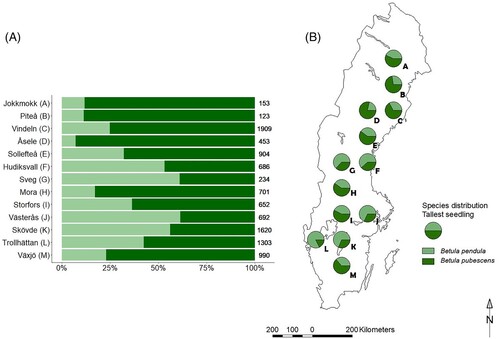
Table 3. Latitude, number of sites planted with each species, number of sites with signs of soil scarification, and soil moisture class per plot by region.
Table 4. Recorded species composition in the form of average number of stems per species, hectare and region, and average height (dm) of the two tallest seedlings in each plot for each region within brackets.
Table 5. Equation (1) summary output of analysis of variance (type II Wald χ2 test), model estimate and adjusted R2.
Data availability statement
The datasets generated during the current study, apart from the data provided by the Swedish National Forest Inventory, are available from the corresponding author on reasonable request. The data provided by the Swedish National Forest Inventory is available through Riksskogstaxeringen, SLU, Umeå, https://www.slu.se/riksskogstaxeringen.