Figures & data
Table I. Distribution of the 117 cases according to TNM classification (2002). Distribution of patients and tumor characteristics (117cases)
Figure 1. The cause-specific survival rate in 177 stage III mobile tongue cancer patients.
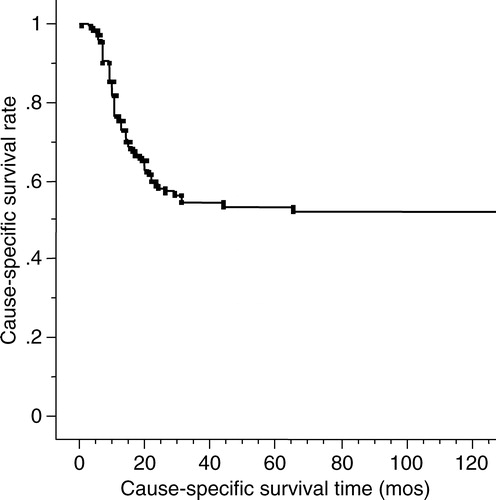
Figure 2. The cause-specific survival rates according to the T and N classifications. Subgroups of stage III show a statistical significance with close relationship to the presence of neck node metastasis.
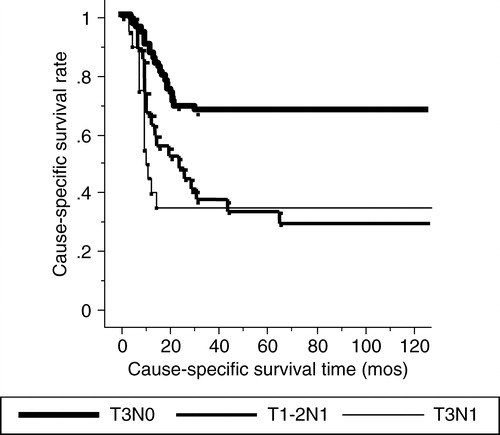
Figure 3. The cause-specific survival rates according to the macroscopic type. Invasive and exophytic types show poor prognosis compared to superficial type with statistical significance.
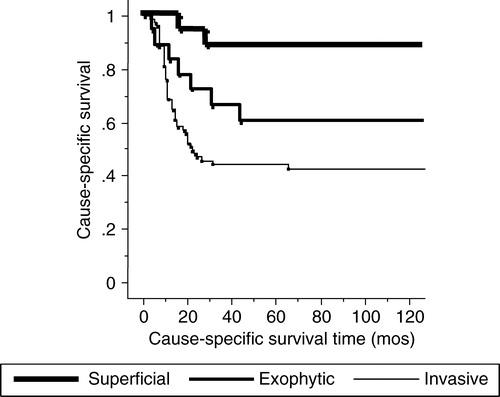
Table II. Prognostic factors in 117 patients for cause-specific survival
Figure 4. The local control rates in 177 stage III mobile tongue cancer patients.
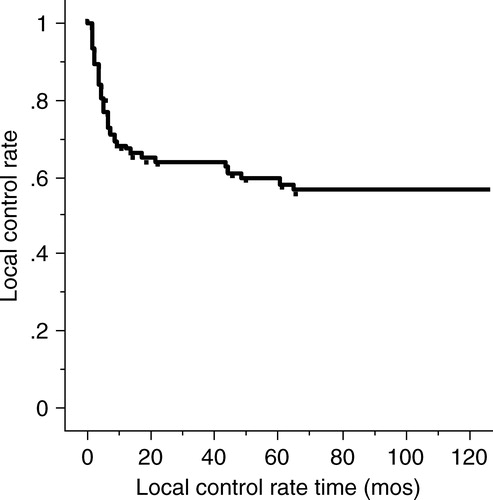
Table III. Primary tumor and neck node metastasis controls according to macroscopic types