Figures & data
Table I. Patient characteristics in 37 postmenopausal women with and without hormone therapy at diagnosis, undergoing surgery for invasive ductal breast cancer.
Figure 1. Representative pictures of immunostaining for ERα (a: normal; b: cancer) and ERß (c: normal; d: cancer) in paired breast tissue samples. Pictures e–h denote immunostaining for PRA (e: no HT; f: HT) and PRB (g: no HT; h: HT) in tumor tissue from two individual women without and with hormone therapy. Pictures i–l represent negative controls (i: ERα normal; j: ERß normal; k: PRA cancer and l: PRB cancer).
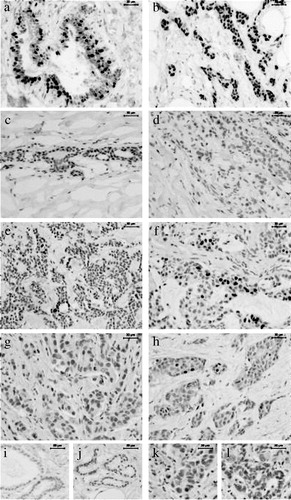
Figure 2. Image analysis score for the whole material. Percentage area of cells positive for ERα (normal n = 29; cancer n = 33) and for ERß (normal n = 29; cancer n = 32). Box-and-whisker plots representing the median value with 50% of all data falling within the box. The “whiskers” represent the range.
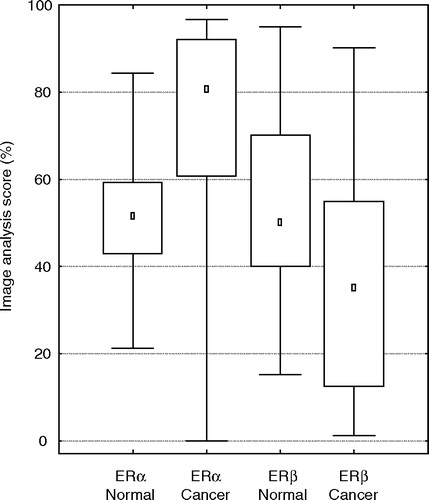
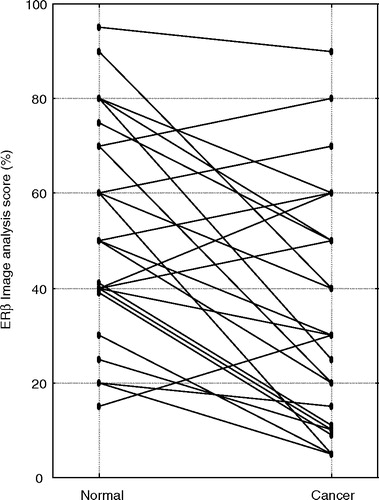
Figure 3. Image analysis score for the expression of ERß in paired samples of normal and cancer tissue obtained from 25 postmenopausal women.