Figures & data
Table I. Demographic and clinical data of patients.
Table II. LA results by size of liver metastases.
Figure 1. (a) Recurrent colorectal metastasis of the liver in a patient who had already undegone a partial resection of the right lobe. A helical CT scan shows a hypoattenuating lesion 2.7 cm in diameter in segment 3 of the left lobe.
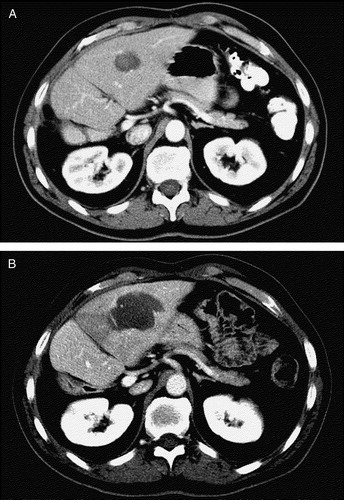
Figure 2. (b) 24 hours after percutaneous laser ablation a contrast-enhanced CT scan shows complete ablation of the lesion. The necrotic area appears as a hypoattenuating area 4.5 cm in diameter. During follow-up (40 months) new lesions appeared in segment 2, which were successfully treated with percutaneous laser ablation.
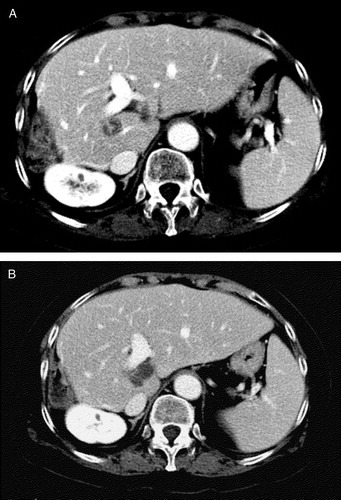
Figure 3. Kaplan-Meier estimate of overall survival in patients with complete and partial necrosis of metastases.
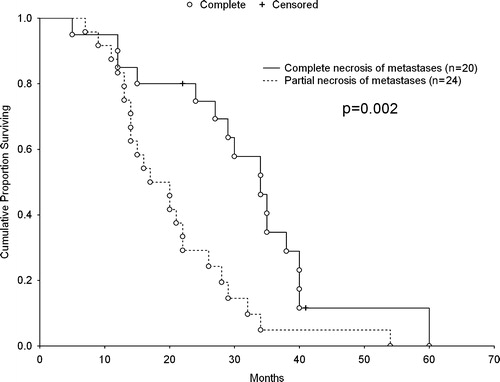
Table III. Local tumor control data, in cases where a complete necrosis was achieved, at 3 and 6 months after LA.