Figures & data
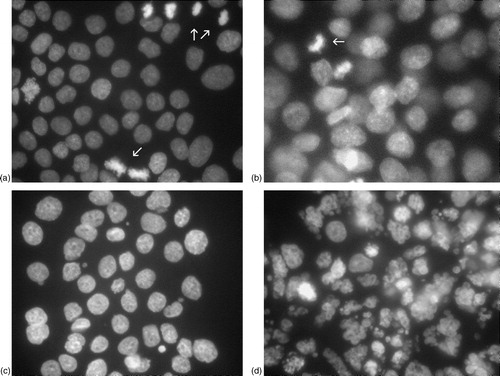
Figure 1. (A) and (B): As compared with untreated control cells, treatment with ZOL in concentrations from 6.25 µM or higher showed a statistically significant and dose-dependent lower number of viable PC3 cells. For the DU145 cells, higher concentrations of ZOL, i.e. 50 µM and 100 µM, were needed to achieve statistically significant cytostatic effects. Error bars indicate standard deviations.
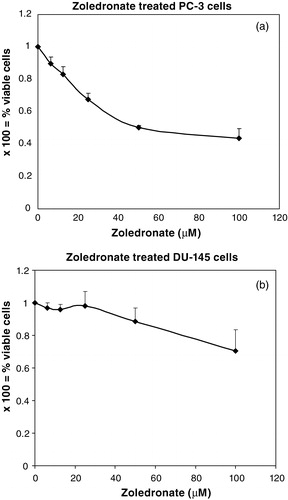
Figure 2. (A): At a DOC concentration of 1 ng/ml and a ZOL concentration of 25 µM, an additive cytostatic effect is obtained since the number of viable PC3 cells following this combined treatment is lower than with treatment with either ZOL or DOC alone. Error bars indicate standard deviations. (B): At a concentration of DOC of 0.1 ng/ml, addition of 25 µM or 50 µM ZOL causes a cytostatic effect on DU145 cells which significantly differs from treatment with either of these drugs alone and furthermore is synergistic. This effect is abundant also at a DOC concentration of 0.01 ng/ml in combination with ZOL 50 µM. Error bars indicate standard deviations.
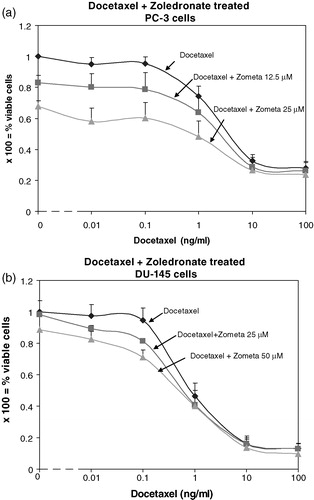
Figure 3. (A) and (B): Representative examples of the morphological evaluation following DAPI preparation of the cells are shown. In (A), treatment with DOC (0.1 ng/ml) only is shown. The arrow indicates a mitotic cell; mitoses were abundant at this DOC concentration. Following single treatment with ZOL (50 µM), mitotic cells were also frequent (the arrow indicate such an example). The combined treatment (C) reduced the number of mitotic cells, an observation in accordance with decreased proliferation. Apoptotic cells, as seen in the positive control (DOC 10 ng/ml) (D), were, though, still rare (apoptotic cells indicated by arrows).