Figures & data
Table I. Number and distribution of patient parameters
Table II. Distribution of treatment parameters
Figure 1. CT slices showing target volumes and dose distributions for a typical radiation treatment in the a) sagittal plane and b) transversal plane. Volumes: Yellow (2) = GTV, Red (7) = PTV (T), Yellow (3) = PTV (N), Green (8) = spinal cord. Isodoses:Orange = 68.0 Gy (105%), Green = 61.4 Gy (95%), Blue = 40.8 Gy (63%), Lilac = 20 Gy (30%) Field sizes:0–40.8 Gy = 14×11 cm 40.8–64.6 Gy = 8×9.5 cm CT = computer tomography, GTV = gross tumor volume, PTV(T) = planning target volume (tumor), PTV(N) = planning target volume (node).
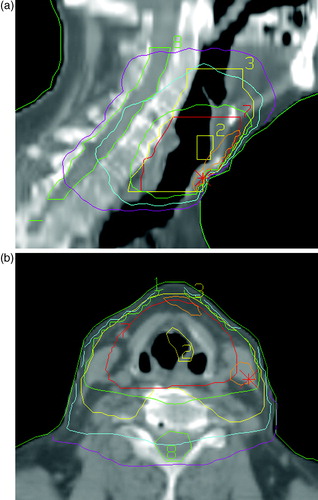
Figure 2. Loco-regional control probabilities for patients with T3 (narrow line) and T4 (thick line) tumors.
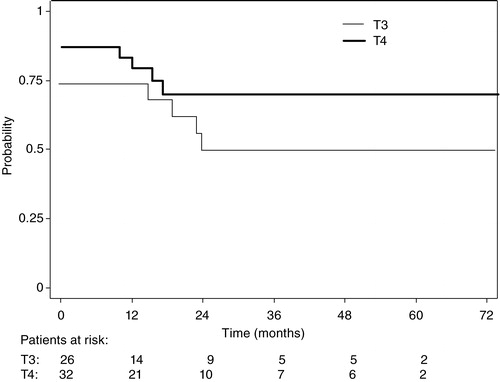
Figure 3. Disease-free survival probabilities for patients with T3 (narrow line) and T4 (thick line) tumors.
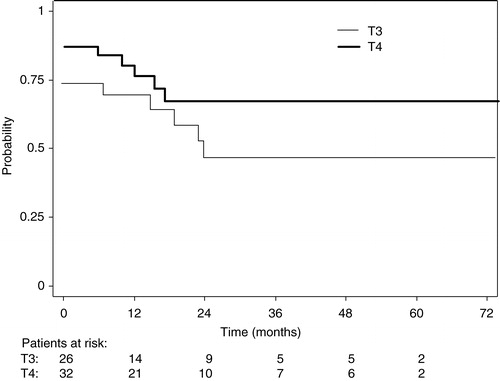
Figure 4. Overall survival probabilities for patients with T3 (narrow line) and T4 (thick line) tumors.
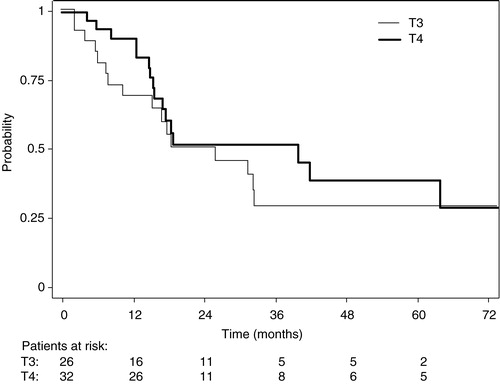
Table III. 5-year survival probabilities for patients with T3 and T4 tumors
Table IV. 5-year survival probabilities for patients receiving induction chemotherapy versus no induction chemotherapy
Table V. Causes of death