Figures & data
Table I. The sequences of the primer and Taqman probe.
Figure 1. Fluorescent intensity curves for GR–a standard, from left to right the concentration of standard is 1×10⁸, 1×10⁷, 1×10⁶ and 1×10⁵ copies/ml.
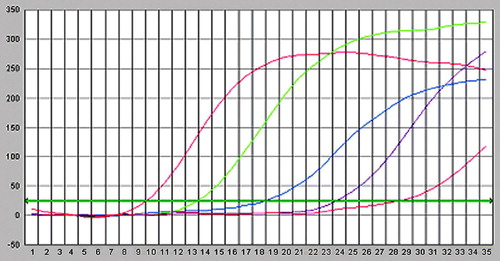
Figure 2. Fluorescent intensity curves for GR–β standard, from left to right the concentration of standard is 1×10⁸, 1×10⁷, 1×10⁶ and 1×10⁵ copies/ml.
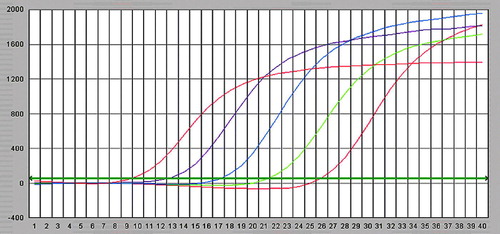
Figure 3. Fluorescent intensity curves for negative control (distilled water) standard.
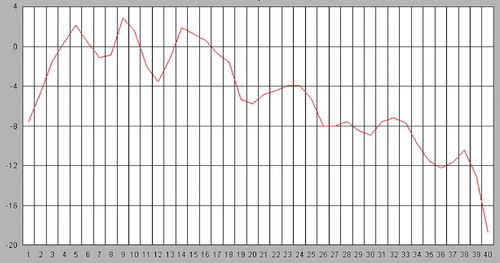
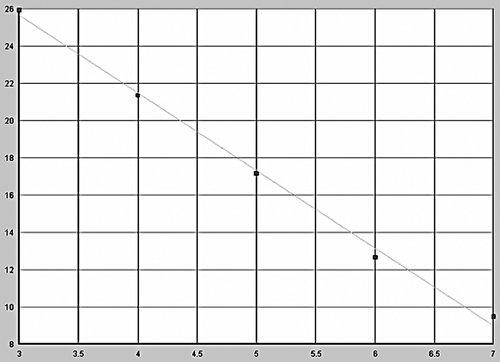
Figure 4. The standard curve for GR–α.
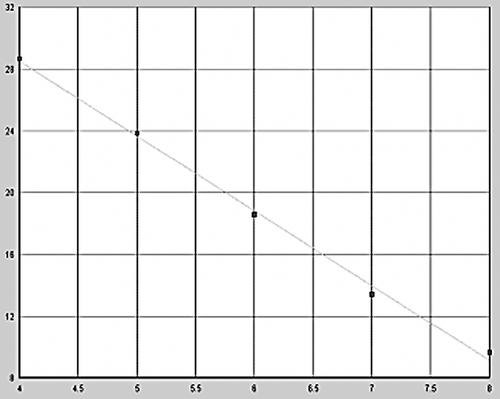
Figure 5. The standard curve for GR–β.