Figures & data
Table I. Grading of histologic changes
Table II. Concentrations of vitamin E, LTB4, TBARS, hemoglobin and leukocyte count
Table III. Concentrations of calprotectin, S100A12 and lactoferrin
Figure 1. Symptom scores (TSS) before, during and after radiotherapy. Median and interquartile range shown in black; individual patients’ TSS in grey. TSS: Total Symptom Scores: sum of scores from five questions grading nausea, abdominal pains, excessive gas, loose stools and painful defecations; “0” meaning no problem, “10” very much problem on each of the 5 questions. (n = 20)
Figure 2. Biopsy scores before, during and after radiotherapy. Median and interquartile range shown in black; individual patients’ sums in grey. Individual patients’ sum from the biopsy evaluation (). (n = 19)
Figure 3. Histological sections from rectal mucosa biopsies. A and B: Hematoxylin & Eosin stained sections. A: Before RT. Note regularity of glands, goblet cells in epithelium and normal height of epithelium. B: Week 2. Reduced number of glands and goblet cells and atrophy of epithelium and fibrosis. C and D: Trichrom Blue staining of collagenous material. C: Before RT. Basal membrane is stained blue. D: Week 6. Increased collagen in lamina propria stroma and reduced number of glands. All photomicrographs at magnification×100.
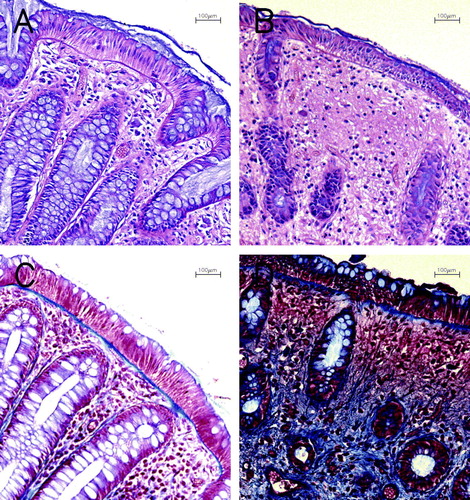
Figure 4. Vitamin E in plasma before, during and after radiotherapy. Median and interquartile range shown in black; individual patients’ concentrations shown in grey. (n = 20)
Table IV. Fatty acids in rectal mucosa biopsies
Table V. Fatty acids in plasma samples
Figure 5. Lactoferrin in stool samples before, during and after radiotherapy. Median and interquartile range shown in black; individual patients’ concentrations in grey. (n = 20)