1,582
Views
23
CrossRef citations to date
0
Altmetric
ORIGINAL ARTICLE

Expression microarray analysis reveals genes associated with in vitro resistance to cisplatin in a cell line model

, , , &
Pages 651-658 | Received 04 Aug 2006, Published online: 08 Jul 2009

Figures & data

Table I.  Primers used successfully for RT-qPCR and RT-PCR. Sequences were selected using a design service (Sigma-Aldrich), RTPrimerDB (http://medgen.ugent.be/rtprimerdb/) or PrimerBank (http://pga.mgh.harvard.edu/primerbank/).

Figure 1.  Relative resistance of MCF-7CR and MCF-7 cells to cisplatin (CDDP) over the concentration range 0–117 µM (final concentration in media). Each point represents the means of at least 3 individual experiments and error bars* represent the standard error of the mean for each point. The IC50 values of MCF-7 and MCF-7CR were 48 µM and 79 µM respectively, making MCF-7CR approximately 1.6-fold more resistant to cisplatin than the MCF-7 parent line. The MCF-7CR cells were significantly more resistant to cisplatin than MCF-7 cells over the dose range 50–117 µM (p < 0.05 by ANOVA). *Error bars are less than the size of the data point symbols.
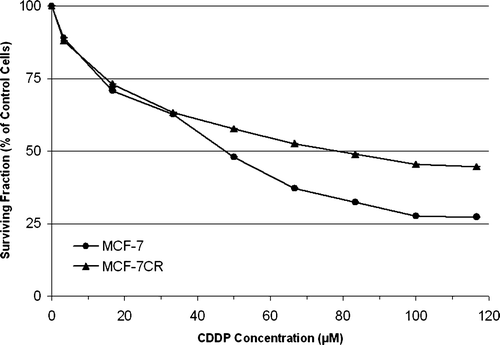
Figure 1.  Relative resistance of MCF-7CR and MCF-7 cells to cisplatin (CDDP) over the concentration range 0–117 µM (final concentration in media). Each point represents the means of at least 3 individual experiments and error bars* represent the standard error of the mean for each point. The IC50 values of MCF-7 and MCF-7CR were 48 µM and 79 µM respectively, making MCF-7CR approximately 1.6-fold more resistant to cisplatin than the MCF-7 parent line. The MCF-7CR cells were significantly more resistant to cisplatin than MCF-7 cells over the dose range 50–117 µM (p < 0.05 by ANOVA). *Error bars are less than the size of the data point symbols.

Figure 2.  RT-PCR analysis of the expression of four membrane bound drug transporters commonly associated with chemotherapy resistance in breast cancer in the parent and derivative cell lines used in this study. L Ladder; M MCF-7; MC MCF-7CR.
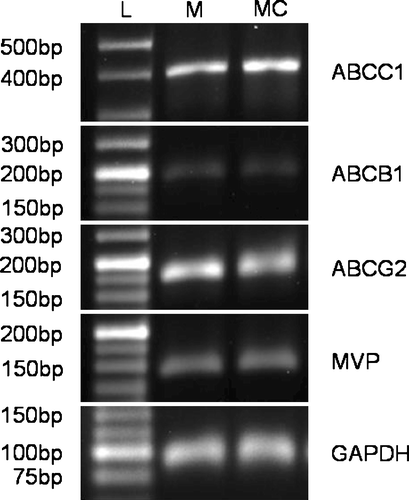
Figure 2.  RT-PCR analysis of the expression of four membrane bound drug transporters commonly associated with chemotherapy resistance in breast cancer in the parent and derivative cell lines used in this study. L Ladder; M MCF-7; MC MCF-7CR.

Table II.  Expression values for each of the genes identified as significantly associated with the observed in vitro resistance of MCF-7CR to cisplatin using expression MA analysis. Gene ontology information was derived from the GOA database (http://www.ebi.ac.uk/GOA/). *Target selected for RT-qPCR confirmation.
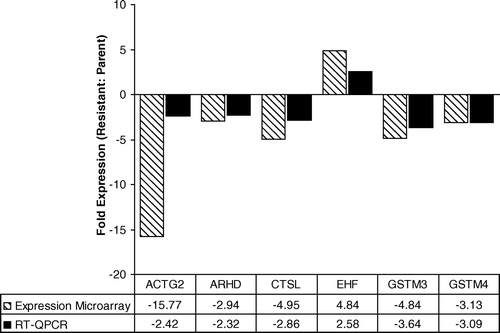
Figure 3.  Fold change in expression values between MCF-7 and MCF-7CR cells for 6 genes derived using expression MA and RT-qPCR analysis.

Figure 3.  Fold change in expression values between MCF-7 and MCF-7CR cells for 6 genes derived using expression MA and RT-qPCR analysis.

Reprints and Corporate Permissions

Please note: Selecting permissions does not provide access to the full text of the article, please see our help page How do I view content?

To request a reprint or corporate permissions for this article, please click on the relevant link below:

Academic Permissions

Please note: Selecting permissions does not provide access to the full text of the article, please see our help page How do I view content?

Obtain permissions instantly via Rightslink by clicking on the button below:

If you are unable to obtain permissions via Rightslink, please complete and submit this Permissions form. For more information, please visit our Permissions help page.