Figures & data
Figure 1. The optimization geometry. The beam edges are shown as dashed thick lines. The aim is to maximize the shaded area of: (1) the portion of PTV irradiated , and (2) the portion of OARs spared
.
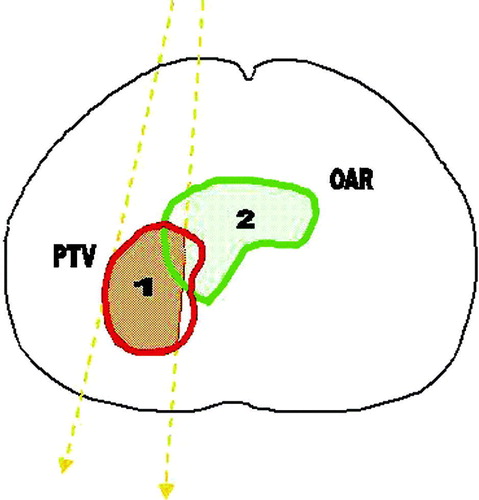
Figure 2. The test case consisting of a spherical PTV of radius 20 mm and two spherical OAR's of radius 40 mm. (a) 3D view of the geometry-Four beams are selected at the positions with the highest GFF and are represented as lines. (b) The results are wrapped away from the isocenter to better understand the position of the high-feasibility regions. Regions with low GFF are slightly deformed, and thus remain near their original position (represented as dots) while regions with high GFF are substantially deformed. (c) GFF analysis as done by the system and the resulting graph for manual selection of beam directions is displayed (d) GFF analysis for different importance factors assigned to the critical structures. The GFF for beam positions passing through the second OAR have changed proportionally to the weighting factor change.
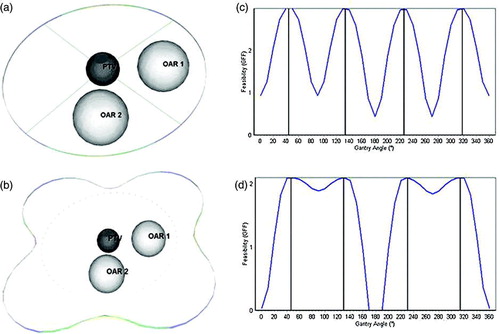
Figure 3. Selection of arcs for the test case. (a) Irradiation with four coplanar arcs, where both OARs have the same importance factor of 1. A minimum GFF value of 0.9 and a minimum arc length of 10° have been selected as selection criteria. The arcs selected by the system are represented as semi-transparent gray fans: 20°–80°, 100°–160°, 200°–250° and 300°–350°. (b) GFF feasibility graph for the selected of arcs. The starting and finishing angles of the arcs are represented as vertical lines superimposed on the GFF graph, while the minimum GFF value is represented by the horizontal bar. The system selected results can be altered by changing the bar's location using the mouse.
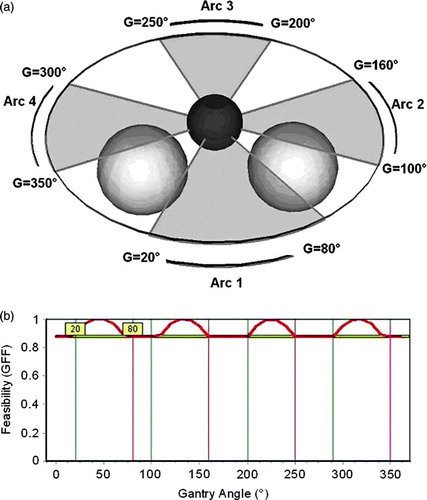
Figure 4. The brain tumor case. (a) Irradiation with a non-coplanar technique using shielding and without margin defined for around PTV or OARs. The selected beams are represented as lines with arrows at the entrance point. For each beam, the corresponding gantry (G) and table angles (T) are marked nearby. (b) GFF feasibility graphs for the table angles of 40° (dotted line), 336° (dash-dotted line) and 357° (line), corresponding to the selected beams. The three selected beams are represented as vertical lines superimposed on the GFF graphs.
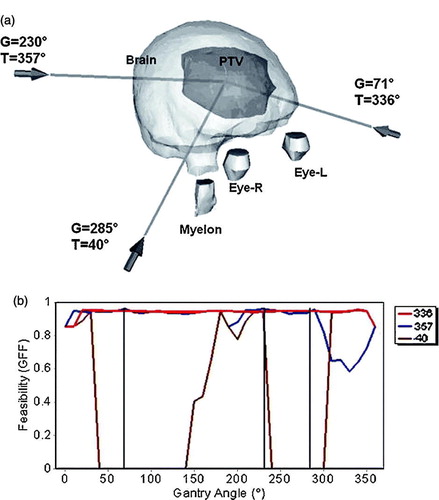
Figure 5. DVH analysis for the brain tumor case. The clinical plan represented by a full curve, an optimized plan with a dashed line.
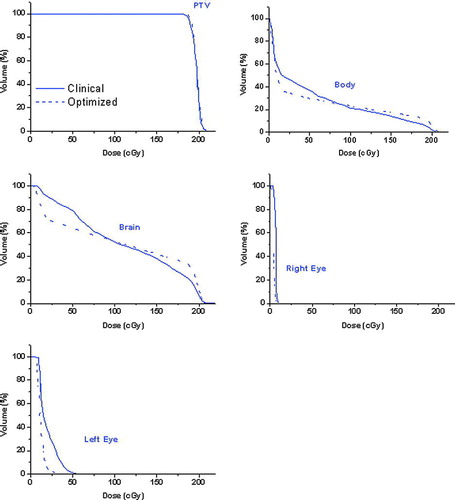
Figure 6. The second brain tumor case containing several OARs, was used to test the arc selection algorithm. (a) Graphical representation of the selected arcs. (b) GFF graphs for the table angle (T) of 20°.
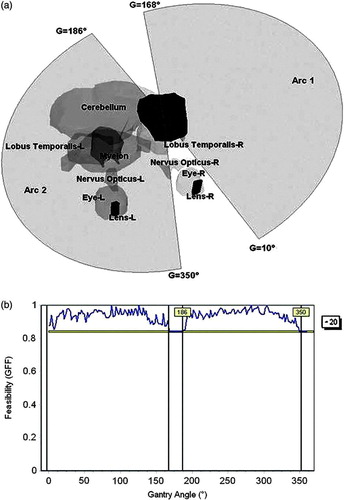
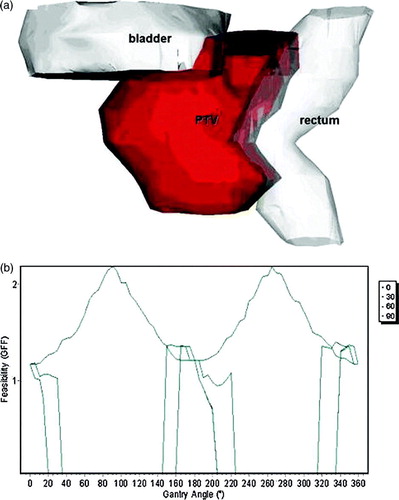
Figure 7. The prostate case. The rectum and the bladder have been delineated as OAR's, with assigned weights of 1 and 0.5 respectively. (a) 3D view of the contoured anatomy. (b) Feasibility graph for the gantry angles of four table angles (0°, 30°, 60° and 90°).