Figures & data
Table I. Clinical summary of renal cell carcinomas.
Figure 1. Approximate size and location in the kidneys of all tumors treated. Note that all patients had only one kidney at SBRT. This summation pictures what a projection of the treated tumor looks like in a normal individual.
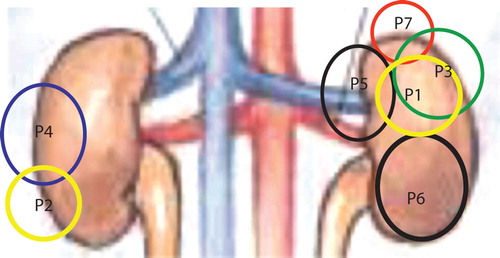
Table II. Data for patients treated for metastases of an initial renal cancer to a second kidney.
Figure 2. Upper figure (a) shows the CTV and PTV of patient 5 at first treatment. Lower figures (b) shows the relative dose distribution, with the prescription isodose (100% in blue), at the periphery of the PTV.c) Relative dose distribution to the target in sagittal view. The color codes of the isodoses are also shown.
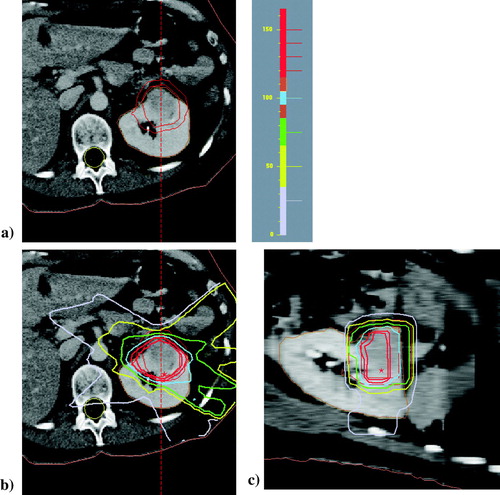
Figure 3. Serum creatinine levels in all seven patients during follow-up. (.-◊-.) patient 1, (- -▴ - -) patient 2, (….∇….) patient 3, (- -▪- -) patient 4, (–•–) patient 5, (–○–) patient 6, (-.-•-.-) patient 7.
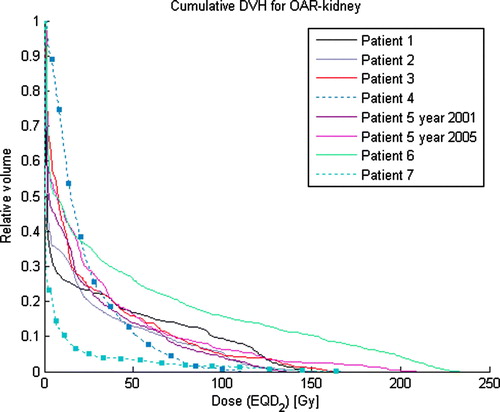
Figure 4. Cumulative dose-volume histogram for OAR-kidneys in all seven patients. Dose on the x-axis is expressed as equivalent dose in 2 Gy/ fraction (EQD2), and volume on the y-axis as relative volume (percent of remaining normal kidney parenchyma minus CTV). Patients no. 4 and 7 are marked with filled boxes.