Figures & data
Table I. Demographics of the 13 volunteers
Figure 1. The mean and SD of the breathing cycle amplitude distribution in free and coached breathing from day 1. Free breathing – white, coach 1 – hatched, coach 2 – grey.
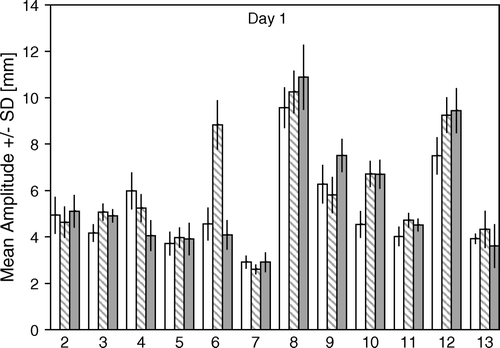
Figure 2. Comparisons of the SD of the breathing cycle amplitude distribution between free breathing and coach 1 (a) and free breathing and coach 2 (b) in the reference session.
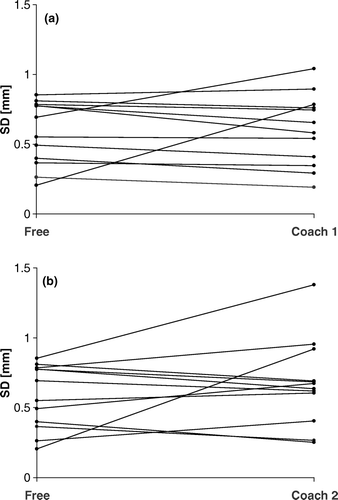
Figure 3a-e. The mean and SD of the breathing cycle amplitude distribution in the simulated courses. Day 1 – white, day 2 – hatched, day 3 – grey. a) free all three days. b) coach 1 day1, free day 2 + 3. c) coach 2 day1, free day 2 + 3. d) coach 1 all three days. e) coach 2 all three days.
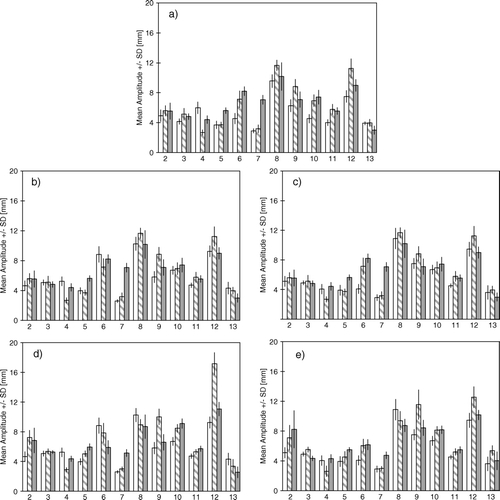
Figure 4a-f. The SD of the breathing cycle amplitude distribution (a-c) and the normalised SD of the breathing cycle amplitude distribution (d-f) for free breathing, coach 1 and coach 2 on the three days.
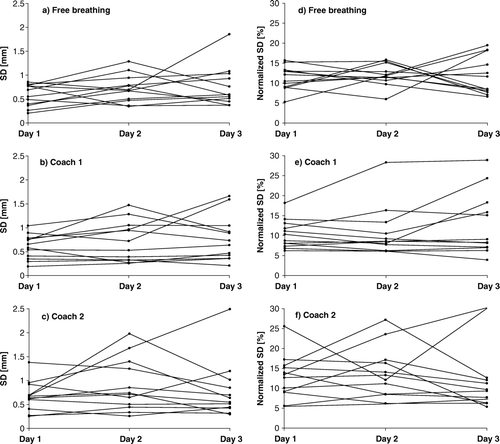
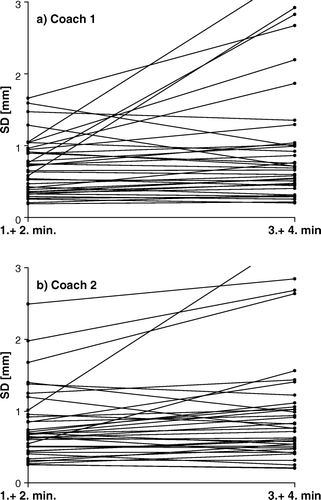
Figure 5. SD of the breathing cycle amplitude distribution from the first two minutes and the following two minutes from all volunteers on all days.