Figures & data
Figure 1. The MORFEUS Algorithm: Contours of the liver and tumor from the planning CT are converted into a volumetric mesh with assigned material properties. Contours of the liver from the kV CBCT are converted into a surface mesh. Boundary conditions are determined from the surface correlation of the livers, which generates boundary conditions. These boundary conditions are used to solve for the deformation map of the entire liver volume, including the tumor, using finite element analysis.
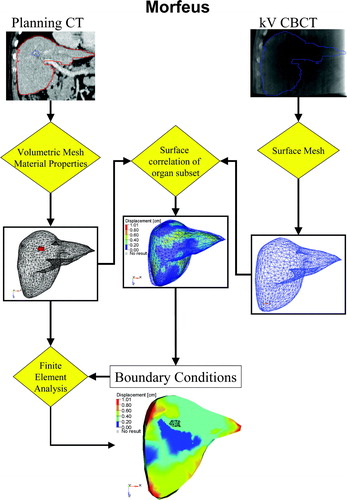
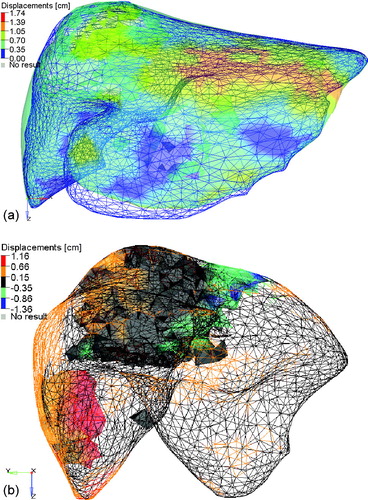
Figure 2. Example of the residual deformation of the liver and tumor between the planning CT (shown in the colorwash) containing the delineated tumor (visible in the left lobe) and the liver defined on the kV CBCT (shown in the blue mesh). The displacements correspond to the vector magnitude of the displacements defined from the deformable registration using MORFEUS. (b) The vector displacement of the tumor, identified on the planning CT, between the position on the planning CT and the kV CBCT on treatment fraction 3. The change in COM was −0.36, −0.29, and 0.29 cm in the left-right, anterior-posterior, and superior-inferior directions, respectively.
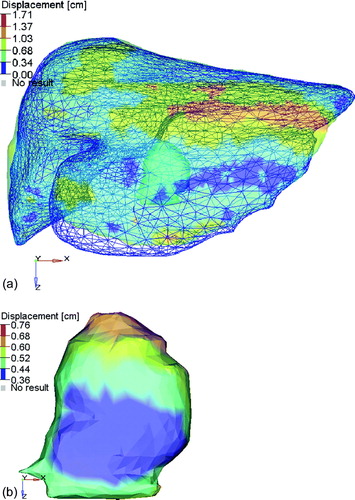
Table I. Change in tumor COM statistics [cm].
Figure 3. The planning CT liver (colorwash of the vector magnitude of the difference between the two liver models) and the CBCT liver at fraction 5 (blue mesh). The tumors (shown as solid shadows within the colorwash) are in the middle and the lower tip of the liver. Differences in the position of the tip of the liver and the dome of the liver can be seen. Alignment of the left lobe of the liver indicates that rotation, as opposed to deformation, could account for the disagreement. (b) The planning CT liver (colorwash of the left-right component of the difference between the two liver models) and the CBCT liver at fraction 5 (black mesh). The tumors (shown as solid shadows within the colorwash) are seen in the middle and the lower tip of the liver.
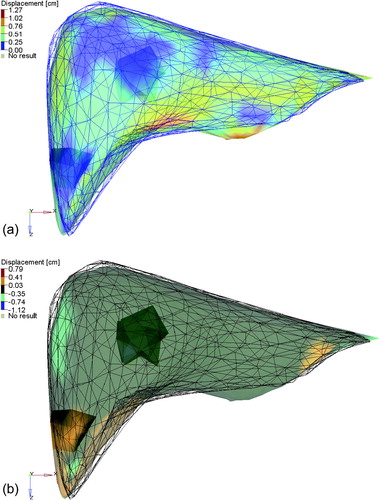
Figure 4. The planning CT liver (colorwash of the vector magnitude of the difference between the two liver models) and the CBCT liver at fraction 3 (blue mesh). (b) The planning CT liver (mesh colorwash of the SI component of the difference between the two liver models) and the CBCT liver at fraction 3 (not shown). The tumors (shown as solid colorwashes) are in the dome and left lobe of the liver.