Figures & data
Table I. Biographic data and tumor classification.
Figure 1. Mastergel with identified protein spots and the corresponding histograms (average protein expression and standard deviation)
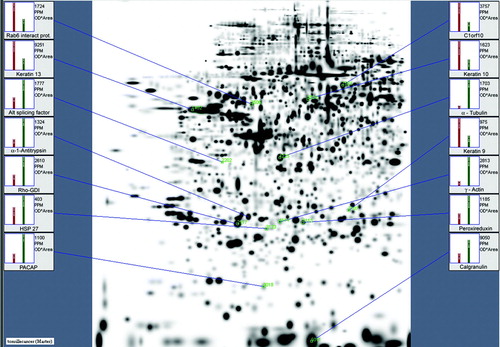
Figure 2. (a) Two representative 2-DE gels, pH 4-7 of a normal and a tumor sample. Close-up areas showing the Rho-GDI protein spot (arrow). (b). Representative PDQuest screenshot showing six segments of “normal gels” and five of “tumor gels”. The Rho-GDI spot is marked with a yellow square throughout all members. The master gel shows the corresponding histograms with the tumor sample marked in green and the normal sample marked in red. (c). Multi-channel view of the same gel-segments (Rho-GDI) visualizing the overexpressed protein in the tumor sample (blue) and the normal control (red). (d). 3-D rendered close-up segments confirming the Rho-GDI over expression in the tumor samples (arrows).
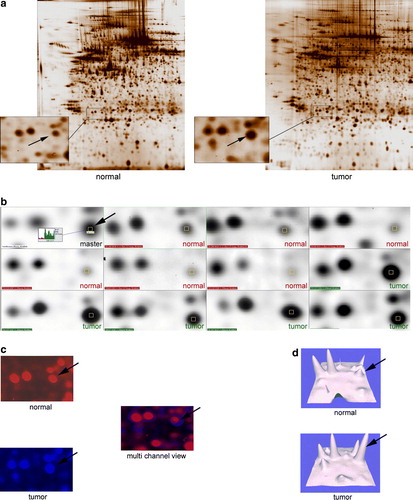
Table II. Identified proteins using MALDI-TOF and Swiss Prot/ Expasy database.