Figures & data
Table I. Patient characteristics at baseline.
Table II. Number of patients on each interval of maximum reached dose and number of patients having their dose reduced at some time during the study.
Table III. Toxicity was registered according to NCI-CTC version 3.0. No grade 4 events were reported. Early side effects were assessed during the first two months giving the patients a chance of reaching 2 µg/kg/week.
Figure 1. Kaplan-Meier curve for time to progression (TTP), n = 28. Median TTP 8 months for the entire study population. One patient had not reached PD at the time of evaluation. Censored patient is shown by a vertical tick mark.
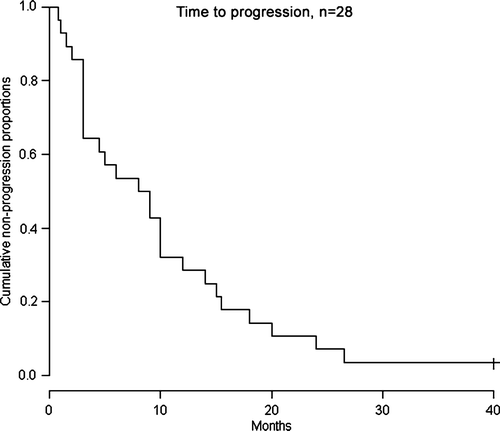
Table IV. Patient characteristics at baseline for those responding with partial response (PR), reaching stable disease (SD) or progressive disease (PD) within six months.
Figure 2. Kaplan-Meier survival curve, until November 2008, n = 28. Median overall survival was 19.5 months. Totally five patients were still alive. Three of these received second-line treatment with targeted drugs. Censored patients are shown by vertical tick marks.
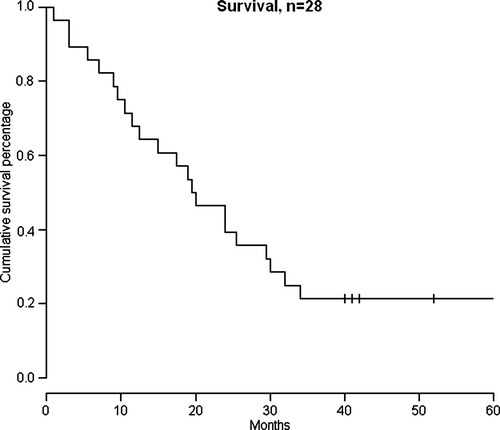
Figure 3. Average VEGF in serum (pg/ml). Levels of VEGF did not correlate to the therapeutic response.
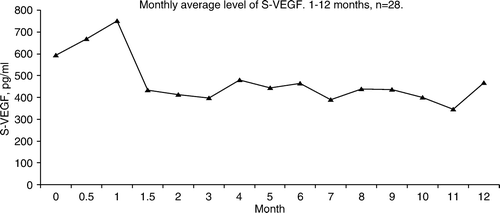
Figure 4. Computed tomography of a patient with lung metastases responding (PR) to treatment. Baseline, A. Three months, B. Ten months, C.
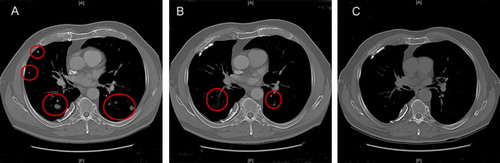
Table V. Patient characteristics at baseline for patients with only lung and/or mediastinal metastases.