Figures & data
Figure 1. Age standardized incidence (per 100 000) of cancer cases with an unknown primary tumour in Sweden during 1960–2007.
Figure 2. (a) Percentage distribution of the ten most frequent forms of cancer among males in Sweden 2006. (b) Percentage distribution of the ten most frequent form of cancer among females in Sweden 2006.
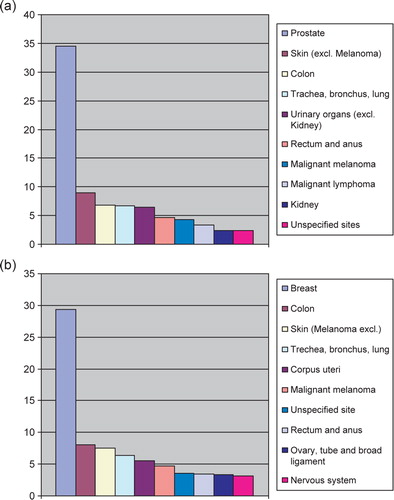
Figure 3. (a) Age standardized cancer incidence of CUP among males in Sweden 1960–2007, the rates were standardized for age in each age-category. (b) Age standardized cancer incidence of CUP among females in Sweden 1960–2007, the rates were standardized for age in each age-category.
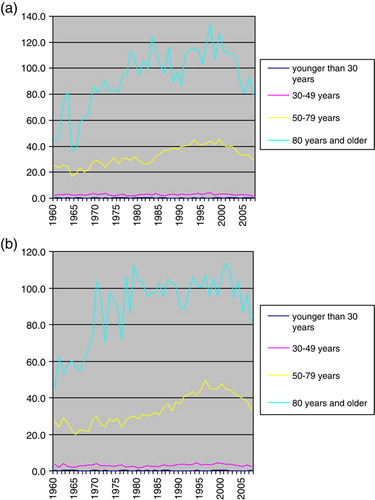
Figure 4. (a) Age standardized incidence of CUP among males 1960–2007 by morphologic type. (b) Age standardized incidence of CUP among females 1960–2007 by morphologic type.
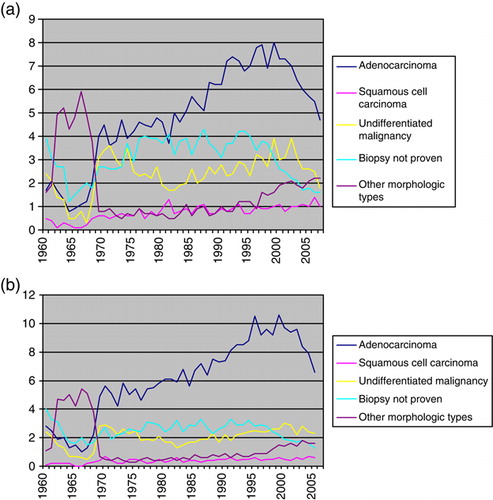
Figure 5. Relative survival by period of diagnosis.
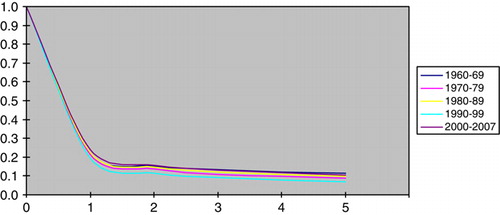
Figure 6. (a) Relative survival among males by age. (b) Relative survival among females by age.
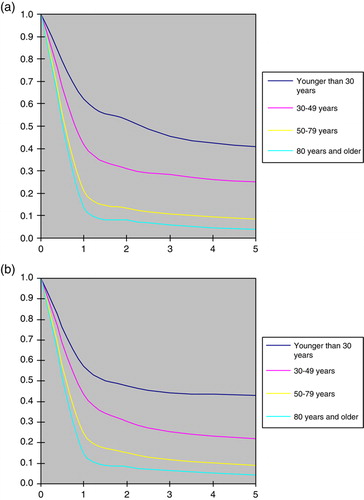
Figure 7. (a) Relative survival among males by morphologic type. (b) Relative survival among females by morphologic type.
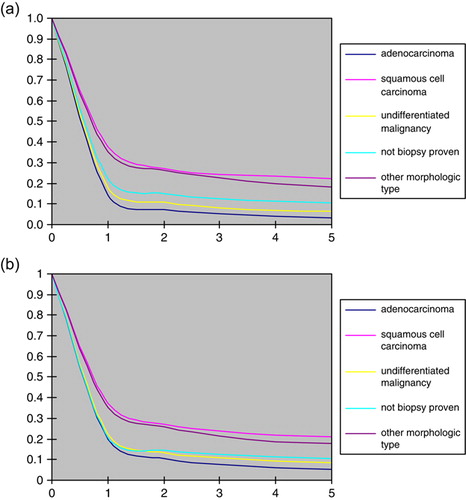
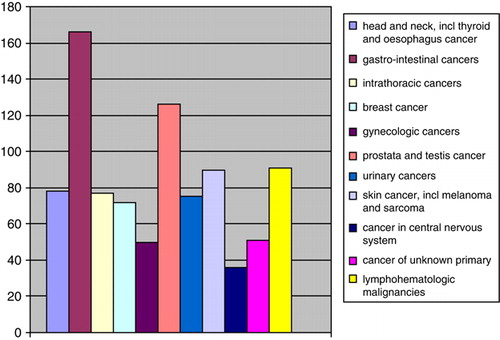
Figure 8. Distribution of tumour sites among those patients who were reported with a new malignancy within five years after their initial CUP diagnosis (number of cases).