Figures & data
Table I. Definitions of grades (codes from the International Classification of Diseases for Oncology, second edition) and corresponding number of cases included in the survival study (1989–1997).
Figure 1. Age-standardized incidence rates per 100 000 in men and women from 1978–1982 to 1998–2002.
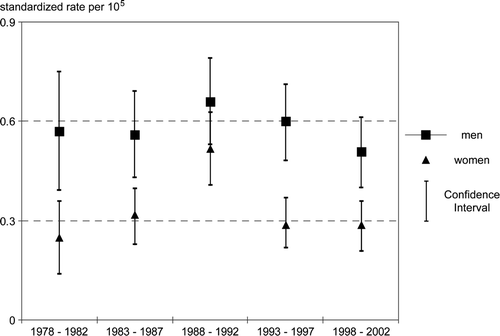
Table II. Evolution of lymphoma grade distribution during the three study periods.
Table III. Survival study population: Number of cases by sex, age and grade of malignancy.
Figure 2. Curve of relative survival by sex for gastric non-Hodgkin's lymphoma diagnosed between January 1, 1989 and December 31, 1997.
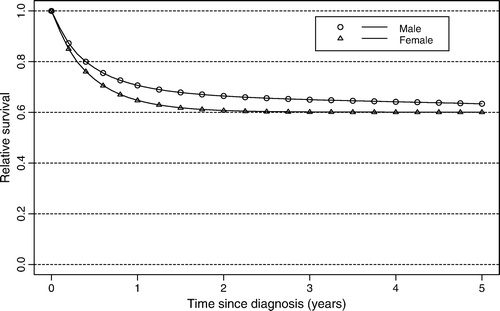
Table IV. Crude and relative survival at 1, 3 and 5 years. Relative survival by grade and by period of diagnosis (% and 95% Confidence Interval).
Figure 3. Curve of relative survival by age for gastric non-Hodgkin's lymphoma diagnosed between January 1, 1989 and December 31, 1997.
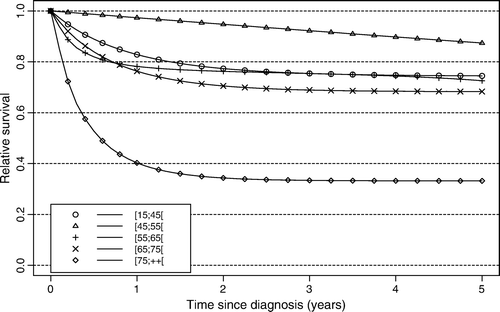
Table V. Multivariate analysis: Effect of covariates on the excess mortality rate (sex, age at diagnosis, year of diagnosis and grade) and 95% confidence interval (CI).
Table VI. Age Standardized incidence Rates (ASR) per 100 000 person-years in population based studies on gastric lymphomas.