962
Views
2
CrossRef citations to date
0
Altmetric
Original Article

Clinical comparative study of dose–volume and equivalent uniform dose based predictions in post radiotherapy acute complications

, , , , &
Pages 1044-1053 | Received 02 Nov 2008, Published online: 08 Oct 2009

Figures & data

Table I.  Numbers of patients by technique (or group). PTV1 is composed of prostate and seminal vesicles, PTV2 refers as the lymphatic nodes.

Table II.  Characteristics of patient population (percent of ill patients in respect to total population, mean dose of ill and safe patients, and standard deviation in the mean doses).

Figure 1.  Selection of best tolerance dose for an acute GI grade larger than 2 based on maximum AUROC value.
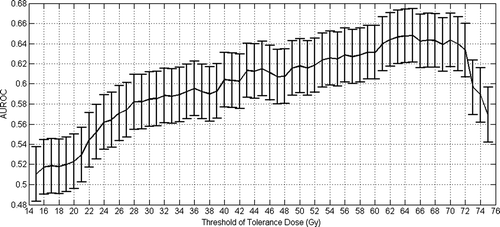
Figure 1.  Selection of best tolerance dose for an acute GI grade larger than 2 based on maximum AUROC value.

Figure 2.  Observed frequencies of acute GI (grade larger than 2) versus V65.

Figure 2.  Observed frequencies of acute GI (grade larger than 2) versus V65.

Figure 3.  Selection of EUD n parameter an acute GI grade larger than 2 based on maximum AUROC value.
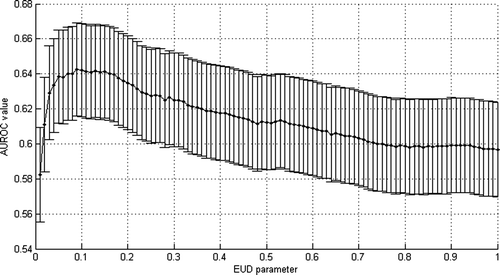
Figure 3.  Selection of EUD n parameter an acute GI grade larger than 2 based on maximum AUROC value.

Figure 4.  Likelihood fitting of acute GI by Lyman's NTCP model and fixing n parameters equal to 0.09.
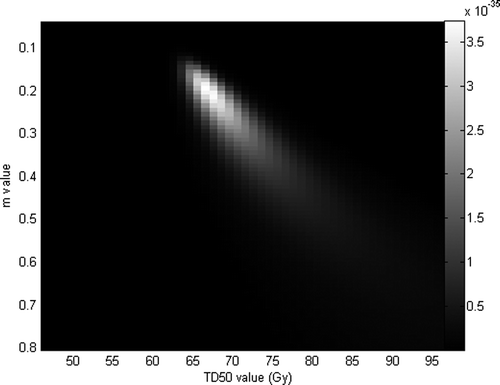
Figure 4.  Likelihood fitting of acute GI by Lyman's NTCP model and fixing n parameters equal to 0.09.

Figure 5.  Observed frequencies of patients suffering acute GI (grade larger than 2) by bin of EUD versus NTCP expected values.
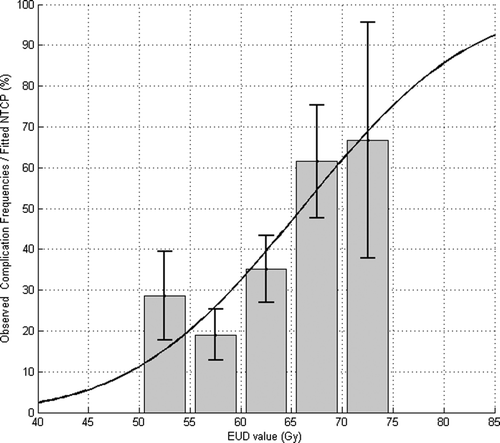
Figure 5.  Observed frequencies of patients suffering acute GI (grade larger than 2) by bin of EUD versus NTCP expected values.

Figure 6.  ROC curves based on both EUD and V65 values (acute GI grade larger than 2).

Figure 6.  ROC curves based on both EUD and V65 values (acute GI grade larger than 2).

Figure 7.  Selection of best tolerance dose for an acute GU grade larger than 2 based on maximum AUROC value.
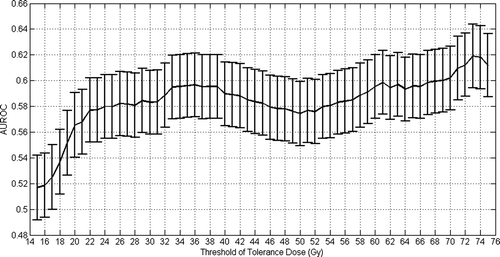
Figure 7.  Selection of best tolerance dose for an acute GU grade larger than 2 based on maximum AUROC value.

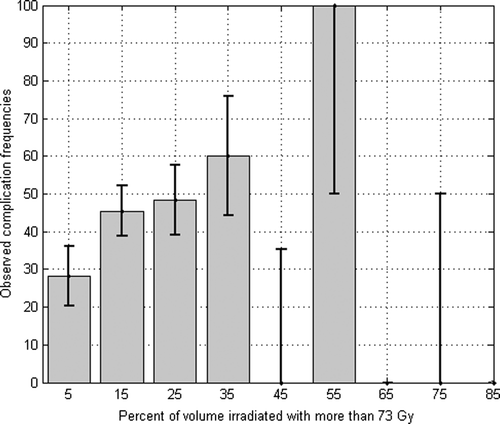
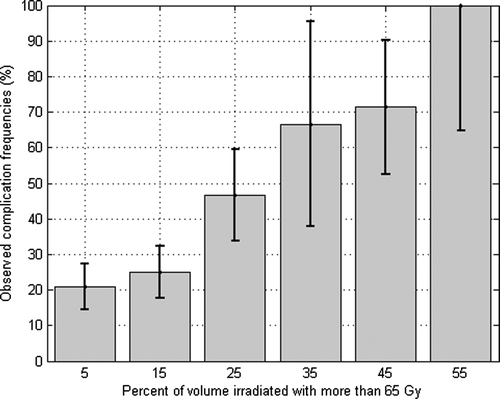
Figure 8.  Observed frequencies of acute GU (grade larger than 2) versus V73.

Figure 8.  Observed frequencies of acute GU (grade larger than 2) versus V73.

Figure 9.  Selection of EUD n parameter an acute GU grade larger than 2 based on maximum AUROC value.
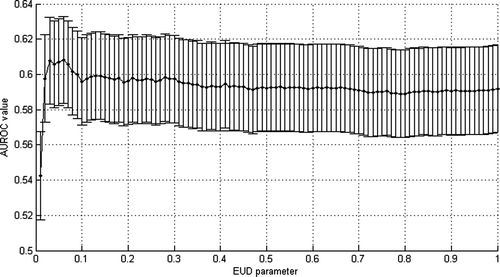
Figure 9.  Selection of EUD n parameter an acute GU grade larger than 2 based on maximum AUROC value.

Figure 10.  Likelihood fitting of acute GU by Lyman's NTCP model and fixing n parameters equal to 0.06.
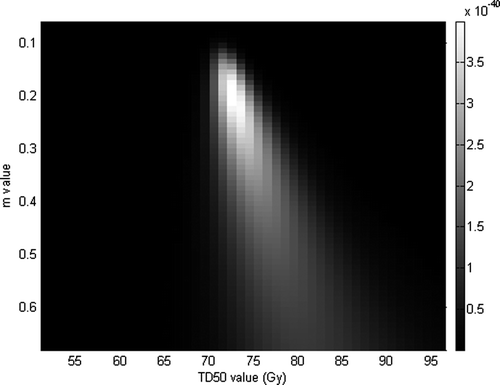
Figure 10.  Likelihood fitting of acute GU by Lyman's NTCP model and fixing n parameters equal to 0.06.

Figure 11.  Observed frequencies of patients suffering acute GU (grade larger than 2) by bin of EUD versus NTCP expected values.
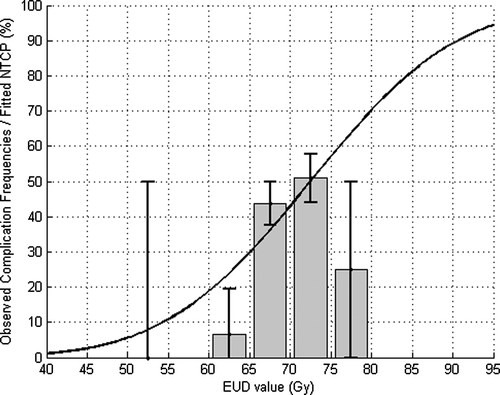
Figure 11.  Observed frequencies of patients suffering acute GU (grade larger than 2) by bin of EUD versus NTCP expected values.

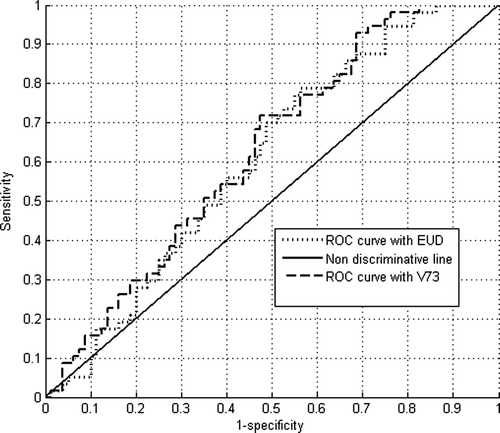
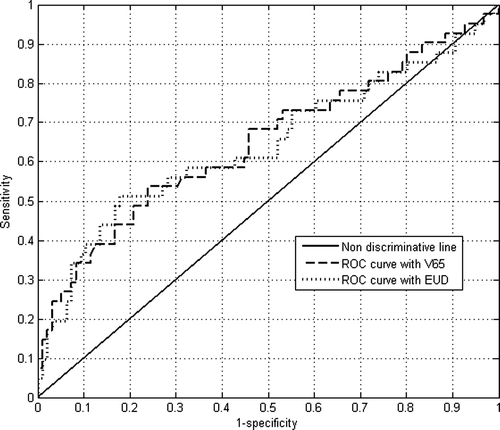
Figure 12.  ROC curves based on both EUD and V73 values (acute GU grade larger than 2.

Figure 12.  ROC curves based on both EUD and V73 values (acute GU grade larger than 2.

Table III.  Summary of AUROC and parameter values by criterion and endpoint.

Table IV.  Fitted LKB NTCP m and TD50 parameters by keeping n equal to 0.09 (Acute GI) and n equal to 0.06 (acute GU), their values obtained for the AUROC comparisons.
Reprints and Corporate Permissions

Please note: Selecting permissions does not provide access to the full text of the article, please see our help page How do I view content?

To request a reprint or corporate permissions for this article, please click on the relevant link below:

Academic Permissions

Please note: Selecting permissions does not provide access to the full text of the article, please see our help page How do I view content?

Obtain permissions instantly via Rightslink by clicking on the button below:

If you are unable to obtain permissions via Rightslink, please complete and submit this Permissions form. For more information, please visit our Permissions help page.