
Figures & data
Figure 1. Inclusion and follow-up of patients.
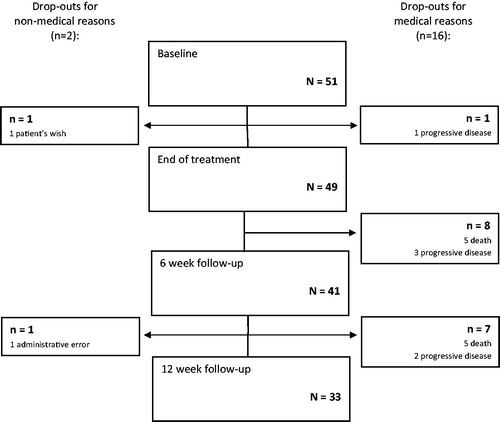
Table 1. Patient characteristics at baseline.
Table 2. Palliative pelvic radiotherapy.
Figure 2. Patient-reported target symptom severity over time compared with baseline for the three major target symptoms.
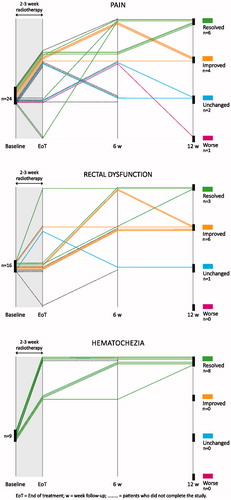
Figure 3. Toxicity. Percent of patients reporting various symptoms at each of the four study visits [B = baseline (n = 51); E = end of treatment (n = 47); 6 = 6-week follow-up (n = 38); 12 = 12-week follow-up (n = 28)]. Symptoms graded according to NCI-CTCAE 3.0. There were no grade 4 symptoms reported.
![Figure 3. Toxicity. Percent of patients reporting various symptoms at each of the four study visits [B = baseline (n = 51); E = end of treatment (n = 47); 6 = 6-week follow-up (n = 38); 12 = 12-week follow-up (n = 28)]. Symptoms graded according to NCI-CTCAE 3.0. There were no grade 4 symptoms reported.](/cms/asset/b6541c4d-dbd3-4664-b4d3-2eda46d8767e/ionc_a_1191666_f0003_c.jpg)
Table 3. Target symptom response and QOL compared to baseline.