Figures & data
Figure 1. The SpiroDynr’X (SDX) system with (a) the mouthpiece to measure airflow and the video goggles that are used to give visual feedback to the patient and (b) the image that is shown to the patient using the video goggles. The patient sees his or her breathing pattern and the green bar indicates the breath-hold window.
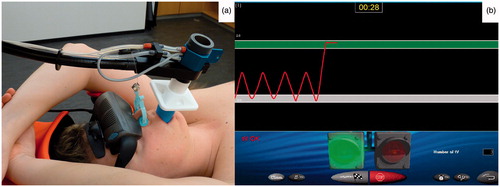
Table 1. Breath-holding feasibility, tumor motion magnitudes during breath-holding, tumor position variations between breath-holds and mean respiratory magnitude for each patient.
Figure 2. For each patient, the daily mean respiratory-induced motion magnitudes of the fiducials measured on CBCT (light boxes) and the motion magnitudes during breath-hold of the fiducials measured using fluoroscopy (dark boxes). The group mean respiratory motion magnitude and group mean motion magnitude during breath-hold were calculated over the 12 and 10 available patients, respectively. Boxes: median value and upper and lower quartiles; whiskers: lowest and highest data point within 1.5 × inter-quartile range; dots: outliers.
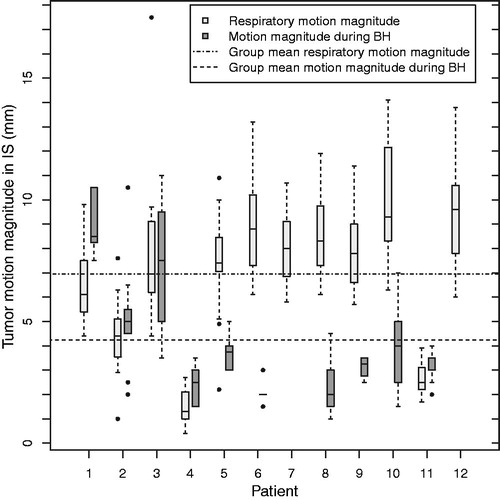
Figure 3. Histograms for the motion during breath-hold and position variation between consecutive breath-holds for fiducials in IS (a,b), fiducials in AP (c,d) and diaphragm in IS (e,f) for all 76 analyzed breath-holds.
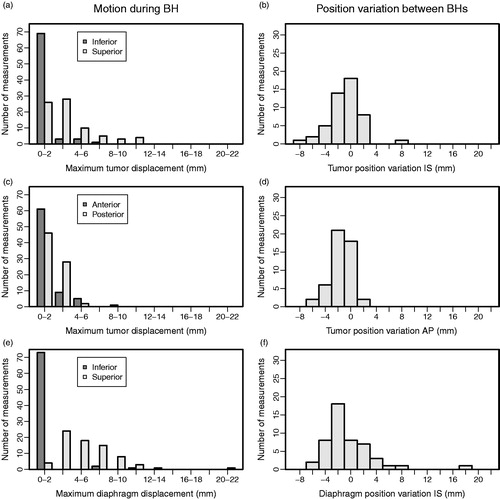
Figure 4. Motion during breath-hold of the fiducials (a–c) and the diaphragm (d–f) and the correlation plots of diaphragm motion versus fiducial motion (g–i) for two measurement days of Patient 3 and one of Patient 4, illustrating the large variations that can be seen within days, between days and between patients. IS displacements of fiducials and diaphragm (g–i) are relative to their position in the first frame of that breath-hold.
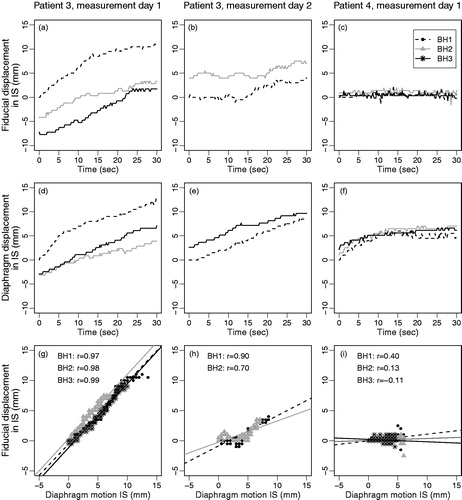
Figure 5. Histograms of the Pearson’s correlation coefficients r (left) and of the slopes of the linear fits (right) in the correlation plot of tumor motion versus inferior-superior diaphragm motion during breath-hold, for tumor motion in (a and b) inferior-superior and (c and d) anterior-posterior direction for all 76 breath-holds.
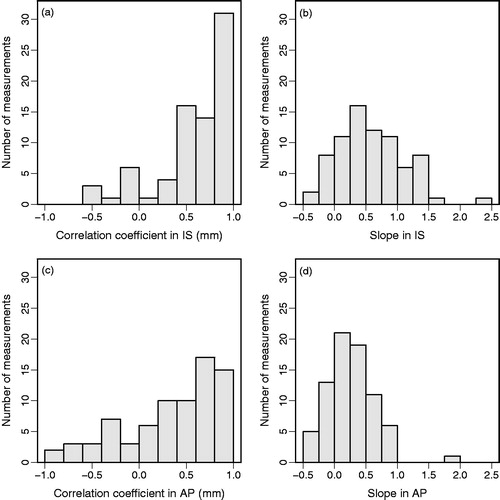
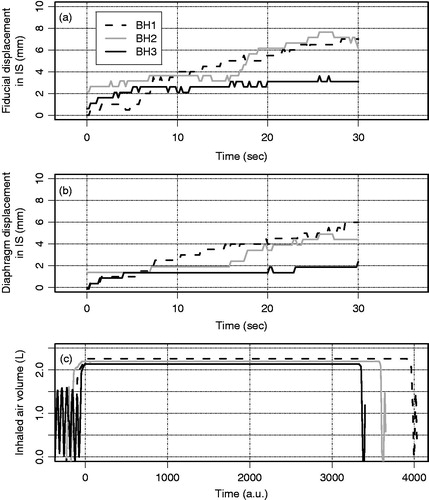
Figure 6. For the three consecutive breath-holds on measurement day 1 of patient 9, the motion during breath-hold of (a) the fiducials and (b) the diaphragm. In (c), the airflow as measured by the spirometer, with the x-axis in arbitrary units (see text).