1,152
Views
6
CrossRef citations to date
0
Altmetric
ORIGINAL ARTICLES: Thoracic Oncology

Optimal gross tumor volume definition in lung-sparing intensity modulated radiotherapy for pleural mesothelioma: an in silico study

, , , , , , , & show all
Pages 1450-1455 | Received 01 Feb 2016, Accepted 04 Sep 2016, Published online: 12 Oct 2016

Figures & data

Table 1. Patients and tumor characteristics.

Figure 1. Images in 69-year-old woman with a newly diagnosed left-sided malignant pleural mesothelioma (epithelioid histology). (a and b): Coronal CT (a) and FDG-PET (b) show a diffuse pleural thickening with diffuse FDG-avid zones, with the exception of a portion of parietal pleura indicated by the arrows (in a and b). (c and d): T2-weighted SPAIR image (c) and contrast-enhanced T1-weighted VIBE image (d) show a possible mesothelioma deposit along the whole lateral pleural surface (arrow in c and d): the region that was negative on the CT (a) and FDG-PET (b) appears to be hyperintense in c and d. Moreover, in c and d the pericardium is hyperintense (arrowhead in c and d), while in a and b is slightly thickened and the FDG-avidity is not clearly visible.

Figure 1. Images in 69-year-old woman with a newly diagnosed left-sided malignant pleural mesothelioma (epithelioid histology). (a and b): Coronal CT (a) and FDG-PET (b) show a diffuse pleural thickening with diffuse FDG-avid zones, with the exception of a portion of parietal pleura indicated by the arrows (in a and b). (c and d): T2-weighted SPAIR image (c) and contrast-enhanced T1-weighted VIBE image (d) show a possible mesothelioma deposit along the whole lateral pleural surface (arrow in c and d): the region that was negative on the CT (a) and FDG-PET (b) appears to be hyperintense in c and d. Moreover, in c and d the pericardium is hyperintense (arrowhead in c and d), while in a and b is slightly thickened and the FDG-avidity is not clearly visible.

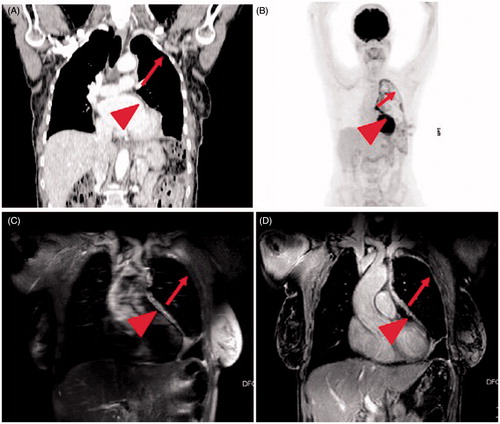
Table 2. Number of patients with additional tumor sites and location details per imaging modality.

Table 3. Visual assessment of the additional tumor sites identified via PET/CT and MRI compared to CT with IVC per patient.

Table 4. GTV Delineation: volume per imaging modality.

Supplemental material

Supplementary_table_220816.docx

Download MS Word (20.7 KB)

Supplementary_material_23082016.docx

Download MS Word (11.6 KB)

Reprints and Corporate Permissions

Please note: Selecting permissions does not provide access to the full text of the article, please see our help page How do I view content?

To request a reprint or corporate permissions for this article, please click on the relevant link below:

Academic Permissions

Please note: Selecting permissions does not provide access to the full text of the article, please see our help page How do I view content?

Obtain permissions instantly via Rightslink by clicking on the button below:

If you are unable to obtain permissions via Rightslink, please complete and submit this Permissions form. For more information, please visit our Permissions help page.